Dskyz (DAFE) Adaptive Regime - Quant Machine ProDskyz (DAFE) Adaptive Regime - Quant Machine Pro:
Buckle up for the Dskyz (DAFE) Adaptive Regime - Quant Machine Pro, is a strategy that’s your ultimate edge for conquering futures markets like ES, MES, NQ, and MNQ. This isn’t just another script—it’s a quant-grade powerhouse, crafted with precision to adapt to market regimes, deliver multi-factor signals, and protect your capital with futures-tuned risk management. With its shimmering DAFE visuals, dual dashboards, and glowing watermark, it turns your charts into a cyberpunk command center, making trading as thrilling as it is profitable.
Unlike generic scripts clogging up the space, the Adaptive Regime is a DAFE original, built from the ground up to tackle the chaos of futures trading. It identifies market regimes (Trending, Range, Volatile, Quiet) using ADX, Bollinger Bands, and HTF indicators, then fires trades based on a weighted scoring system that blends candlestick patterns, RSI, MACD, and more. Add in dynamic stops, trailing exits, and a 5% drawdown circuit breaker, and you’ve got a system that’s as safe as it is aggressive. Whether you’re a newbie or a prop desk pro, this strat’s your ticket to outsmarting the markets. Let’s break down every detail and see why it’s a must-have.
Why Traders Need This Strategy
Futures markets are a gauntlet—fast moves, volatility spikes (like the April 28, 2025 NQ 1k-point drop), and institutional traps that punish the unprepared. Meanwhile, platforms are flooded with low-effort scripts that recycle old ideas with zero innovation. The Adaptive Regime stands tall, offering:
Adaptive Intelligence: Detects market regimes (Trending, Range, Volatile, Quiet) to optimize signals, unlike one-size-fits-all scripts.
Multi-Factor Precision: Combines candlestick patterns, MA trends, RSI, MACD, volume, and HTF confirmation for high-probability trades.
Futures-Optimized Risk: Calculates position sizes based on $ risk (default: $300), with ATR or fixed stops/TPs tailored for ES/MES.
Bulletproof Safety: 5% daily drawdown circuit breaker and trailing stops keep your account intact, even in chaos.
DAFE Visual Mastery: Pulsing Bollinger Band fills, dynamic SL/TP lines, and dual dashboards (metrics + position) make signals crystal-clear and charts a work of art.
Original Craftsmanship: A DAFE creation, built with community passion, not a rehashed clone of generic code.
Traders need this because it’s a complete, adaptive system that blends quant smarts, user-friendly design, and DAFE flair. It’s your edge to trade with confidence, cut through market noise, and leave the copycats in the dust.
Strategy Components
1. Market Regime Detection
The strategy’s brain is its ability to classify market conditions into five regimes, ensuring signals match the environment.
How It Works:
Trending (Regime 1): ADX > 20, fast/slow EMA spread > 0.3x ATR, HTF RSI > 50 or MACD bullish (htf_trend_bull/bear).
Range (Regime 2): ADX < 25, price range < 3% of close, no HTF trend.
Volatile (Regime 3): BB width > 1.5x avg, ATR > 1.2x avg, HTF RSI overbought/oversold.
Quiet (Regime 4): BB width < 0.8x avg, ATR < 0.9x avg.
Other (Regime 5): Default for unclear conditions.
Indicators: ADX (14), BB width (20), ATR (14, 50-bar SMA), HTF RSI (14, daily default), HTF MACD (12,26,9).
Why It’s Brilliant:
Regime detection adapts signals to market context, boosting win rates in trending or volatile conditions.
HTF RSI/MACD add a big-picture filter, rare in basic scripts.
Visualized via gradient background (green for Trending, orange for Range, red for Volatile, gray for Quiet, navy for Other).
2. Multi-Factor Signal Scoring
Entries are driven by a weighted scoring system that combines candlestick patterns, trend, momentum, and volume for robust signals.
Candlestick Patterns:
Bullish: Engulfing (0.5), hammer (0.4 in Range, 0.2 else), morning star (0.2), piercing (0.2), double bottom (0.3 in Volatile, 0.15 else). Must be near support (low ≤ 1.01x 20-bar low) with volume spike (>1.5x 20-bar avg).
Bearish: Engulfing (0.5), shooting star (0.4 in Range, 0.2 else), evening star (0.2), dark cloud (0.2), double top (0.3 in Volatile, 0.15 else). Must be near resistance (high ≥ 0.99x 20-bar high) with volume spike.
Logic: Patterns are weighted higher in specific regimes (e.g., hammer in Range, double bottom in Volatile).
Additional Factors:
Trend: Fast EMA (20) > slow EMA (50) + 0.5x ATR (trend_bull, +0.2); opposite for trend_bear.
RSI: RSI (14) < 30 (rsi_bull, +0.15); > 70 (rsi_bear, +0.15).
MACD: MACD line > signal (12,26,9, macd_bull, +0.15); opposite for macd_bear.
Volume: ATR > 1.2x 50-bar avg (vol_expansion, +0.1).
HTF Confirmation: HTF RSI < 70 and MACD bullish (htf_bull_confirm, +0.2); RSI > 30 and MACD bearish (htf_bear_confirm, +0.2).
Scoring:
bull_score = sum of bullish factors; bear_score = sum of bearish. Entry requires score ≥ 1.0.
Example: Bullish engulfing (0.5) + trend_bull (0.2) + rsi_bull (0.15) + htf_bull_confirm (0.2) = 1.05, triggers long.
Why It’s Brilliant:
Multi-factor scoring ensures signals are confirmed by multiple market dynamics, reducing false positives.
Regime-specific weights make patterns more relevant (e.g., hammers shine in Range markets).
HTF confirmation aligns with the big picture, a quant edge over simplistic scripts.
3. Futures-Tuned Risk Management
The risk system is built for futures, calculating position sizes based on $ risk and offering flexible stops/TPs.
Position Sizing:
Logic: Risk per trade (default: $300) ÷ (stop distance in points * point value) = contracts, capped at max_contracts (default: 5). Point value = tick value (e.g., $12.5 for ES) * ticks per point (4) * contract multiplier (1 for ES, 0.1 for MES).
Example: $300 risk, 8-point stop, ES ($50/point) → 0.75 contracts, rounded to 1.
Impact: Precise sizing prevents over-leverage, critical for micro contracts like MES.
Stops and Take-Profits:
Fixed: Default stop = 8 points, TP = 16 points (2:1 reward/risk).
ATR-Based: Stop = 1.5x ATR (default), TP = 3x ATR, enabled via use_atr_for_stops.
Logic: Stops set at swing low/high ± stop distance; TPs at 2x stop distance from entry.
Impact: ATR stops adapt to volatility, while fixed stops suit stable markets.
Trailing Stops:
Logic: Activates at 50% of TP distance. Trails at close ± 1.5x ATR (atr_multiplier). Longs: max(trail_stop_long, close - ATR * 1.5); shorts: min(trail_stop_short, close + ATR * 1.5).
Impact: Locks in profits during trends, a game-changer in volatile sessions.
Circuit Breaker:
Logic: Pauses trading if daily drawdown > 5% (daily_drawdown = (max_equity - equity) / max_equity).
Impact: Protects capital during black swan events (e.g., April 27, 2025 ES slippage).
Why It’s Brilliant:
Futures-specific inputs (tick value, multiplier) make it plug-and-play for ES/MES.
Trailing stops and circuit breaker add pro-level safety, rare in off-the-shelf scripts.
Flexible stops (ATR or fixed) suit different trading styles.
4. Trade Entry and Exit Logic
Entries and exits are precise, driven by bull_score/bear_score and protected by drawdown checks.
Entry Conditions:
Long: bull_score ≥ 1.0, no position (position_size <= 0), drawdown < 5% (not pause_trading). Calculates contracts, sets stop at swing low - stop points, TP at 2x stop distance.
Short: bear_score ≥ 1.0, position_size >= 0, drawdown < 5%. Stop at swing high + stop points, TP at 2x stop distance.
Logic: Tracks entry_regime for PNL arrays. Closes opposite positions before entering.
Exit Conditions:
Stop-Loss/Take-Profit: Hits stop or TP (strategy.exit).
Trailing Stop: Activates at 50% TP, trails by ATR * 1.5.
Emergency Exit: Closes if price breaches stop (close < long_stop_price or close > short_stop_price).
Reset: Clears stop/TP prices when flat (position_size = 0).
Why It’s Brilliant:
Score-based entries ensure multi-factor confirmation, filtering out weak signals.
Trailing stops maximize profits in trends, unlike static exits in basic scripts.
Emergency exits add an extra safety layer, critical for futures volatility.
5. DAFE Visuals
The visuals are pure DAFE magic, blending function with cyberpunk flair to make signals intuitive and charts stunning.
Shimmering Bollinger Band Fill:
Display: BB basis (20, white), upper/lower (green/red, 45% transparent). Fill pulses (30–50 alpha) by regime, with glow (60–95 alpha) near bands (close ≥ 0.995x upper or ≤ 1.005x lower).
Purpose: Highlights volatility and key levels with a futuristic glow.
Visuals make complex regimes and signals instantly clear, even for newbies.
Pulsing effects and regime-specific colors add a DAFE signature, setting it apart from generic scripts.
BB glow emphasizes tradeable levels, enhancing decision-making.
Chart Background (Regime Heatmap):
Green — Trending Market: Strong, sustained price movement in one direction. The market is in a trend phase—momentum follows through.
Orange — Range-Bound: Market is consolidating or moving sideways, with no clear up/down trend. Great for mean reversion setups.
Red — Volatile Regime: High volatility, heightened risk, and larger/faster price swings—trade with caution.
Gray — Quiet/Low Volatility: Market is calm and inactive, with small moves—often poor conditions for most strategies.
Navy — Other/Neutral: Regime is uncertain or mixed; signals may be less reliable.
Bollinger Bands Glow (Dynamic Fill):
Neon Red Glow — Warning!: Price is near or breaking above the upper band; momentum is overstretched, watch for overbought conditions or reversals.
Bright Green Glow — Opportunity!: Price is near or breaking below the lower band; market could be oversold, prime for bounce or reversal.
Trend Green Fill — Trending Regime: Fills between bands with green when the market is trending, showing clear momentum.
Gold/Yellow Fill — Range Regime: Fills with gold/aqua in range conditions, showing the market is sideways/oscillating.
Magenta/Red Fill — Volatility Spike: Fills with vivid magenta/red during highly volatile regimes.
Blue Fill — Neutral/Quiet: A soft blue glow for other or uncertain market states.
Moving Averages:
Display: Blue fast EMA (20), red slow EMA (50), 2px.
Purpose: Shows trend direction, with trend_dir requiring ATR-scaled spread.
Dynamic SL/TP Lines:
Display: Pulsing colors (red SL, green TP for Trending; yellow/orange for Range, etc.), 3px, with pulse_alpha for shimmer.
Purpose: Tracks stops/TPs in real-time, color-coded by regime.
6. Dual Dashboards
Two dashboards deliver real-time insights, making the strat a quant command center.
Bottom-Left Metrics Dashboard (2x13):
Metrics: Mode (Active/Paused), trend (Bullish/Bearish/Neutral), ATR, ATR avg, volume spike (YES/NO), RSI (value + Oversold/Overbought/Neutral), HTF RSI, HTF trend, last signal (Buy/Sell/None), regime, bull score.
Display: Black (29% transparent), purple title, color-coded (green for bullish, red for bearish).
Purpose: Consolidates market context and signal strength.
Top-Right Position Dashboard (2x7):
Metrics: Regime, position side (Long/Short/None), position PNL ($), SL, TP, daily PNL ($).
Display: Black (29% transparent), purple title, color-coded (lime for Long, red for Short).
Purpose: Tracks live trades and profitability.
Why It’s Brilliant:
Dual dashboards cover market context and trade status, a rare feature.
Color-coding and concise metrics guide beginners (e.g., green “Buy” = go).
Real-time PNL and SL/TP visibility empower disciplined trading.
7. Performance Tracking
Logic: Arrays (regime_pnl_long/short, regime_win/loss_long/short) track PNL and win/loss by regime (1–5). Updated on trade close (barstate.isconfirmed).
Purpose: Prepares for future adaptive thresholds (e.g., adjust bull_score min based on regime performance).
Why It’s Brilliant: Lays the groundwork for self-optimizing logic, a quant edge over static scripts.
Key Features
Regime-Adaptive: Optimizes signals for Trending, Range, Volatile, Quiet markets.
Futures-Optimized: Precise sizing for ES/MES with tick-based risk inputs.
Multi-Factor Signals: Candlestick patterns, RSI, MACD, and HTF confirmation for robust entries.
Dynamic Exits: ATR/fixed stops, 2:1 TPs, and trailing stops maximize profits.
Safe and Smart: 5% drawdown breaker and emergency exits protect capital.
DAFE Visuals: Shimmering BB fill, pulsing SL/TP, and dual dashboards.
Backtest-Ready: Fixed qty and tick calc for accurate historical testing.
How to Use
Add to Chart: Load on a 5min ES/MES chart in TradingView.
Configure Inputs: Set instrument (ES/MES), tick value ($12.5/$1.25), multiplier (1/0.1), risk ($300 default). Enable ATR stops for volatility.
Monitor Dashboards: Bottom-left for regime/signals, top-right for position/PNL.
Backtest: Run in strategy tester to compare regimes.
Live Trade: Connect to Tradovate or similar. Watch for slippage (e.g., April 27, 2025 ES issues).
Replay Test: Try April 28, 2025 NQ drop to see regime shifts and stops.
Disclaimer
Trading futures involves significant risk of loss and is not suitable for all investors. Past performance does not guarantee future results. Backtest results may differ from live trading due to slippage, fees, or market conditions. Use this strategy at your own risk, and consult a financial advisor before trading. Dskyz (DAFE) Trading Systems is not responsible for any losses incurred.
Backtesting:
Frame: 2023-09-20 - 2025-04-29
Slippage: 3
Fee Typical Range (per side, per contract)
CME Exchange $1.14 – $1.20
Clearing $0.10 – $0.30
NFA Regulatory $0.02
Firm/Broker Commis. $0.25 – $0.80 (retail prop)
TOTAL $1.60 – $2.30 per side
Round Turn: (enter+exit) = $3.20 – $4.60 per contract
Final Notes
The Dskyz (DAFE) Adaptive Regime - Quant Machine Pro is more than a strategy—it’s a revolution. Crafted with DAFE’s signature precision, it rises above generic scripts with adaptive regimes, quant-grade signals, and visuals that make trading a thrill. Whether you’re scalping MES or swinging ES, this system empowers you to navigate markets with confidence and style. Join the DAFE crew, light up your charts, and let’s dominate the futures game!
(This publishing will most likely be taken down do to some miscellaneous rule about properly displaying charting symbols, or whatever. Once I've identified what part of the publishing they want to pick on, I'll adjust and repost.)
Use it with discipline. Use it with clarity. Trade smarter.
**I will continue to release incredible strategies and indicators until I turn this into a brand or until someone offers me a contract.
Created by Dskyz, powered by DAFE Trading Systems. Trade smart, trade bold.
Cari dalam skrip untuk "RSI MACD"

Swing Trade TarayıcıSwing Trade Scanner (v6) User Guide
1. Purpose:
This TradingView indicator (written in Pine Script v6) is designed to help identify swing trading opportunities. It calculates an overall trend strength and direction score by combining multiple technical analyses for up to 20 financial assets (stocks, cryptocurrencies, forex, etc.) that you specify. It presents the results in a customizable table, allowing you to quickly scan the market.
2. Analyses Used and Their Roles:
By default, the indicator uses the following 4 main technical analyses:
EMA Crossover (Default: 9/21): Used to capture short-term trend direction and potential momentum shifts. When the fast EMA (9) crosses above the slow EMA (21), it's considered a bullish signal; when it crosses below, it's a bearish signal. It's often one of the main entry/exit triggers.
RSI (Relative Strength Index - Default: 14): Measures the speed of price movements to identify overbought (OB) and oversold (OS) conditions. Reversals from the OB zone can signal potential downturns, while reversals from the OS zone can signal potential upturns. It also provides insight into the strength of the momentum.
MACD (Moving Average Convergence Divergence - Default: 12, 26, 9): A trend-following momentum indicator. The relationship between the MACD line and the signal line (crossovers) and the state of the histogram (position relative to the zero line) are used to confirm momentum shifts and trend strength.
ADX/DI (Average Directional Index - Default: 14, 14): Measures the strength (ADX) and direction (+DI/-DI lines) of a trend. Its main role is to filter signals from other indicators. A trend is considered to exist if the ADX is above a certain threshold (e.g., 25). +DI above -DI indicates an uptrend, and the reverse indicates a downtrend.
3. Scoring System:
The indicator calculates an individual score for each analysis and then combines these scores using weights you define to create a final Trend Score:
Individual Scores: Each analysis (EMA, RSI, MACD, ADX/DI) generates a decimal score between -1.0 (Strong Negative/Bearish) and +1.0 (Strong Positive/Bullish) based on its own rules. For example, RSI might score +1.0 if oversold, -1.0 if overbought, and 0.0 if neutral. MACD and ADX/DI scores can also take intermediate values reflecting both direction and strength (e.g., ±1.0, ±0.6, ±0.3, 0.0).
Weighting: In the settings, you can assign a weight (between 0.0 and 1.0) to each analysis, determining how much it influences the final score. For instance, you might give EMA crossover a higher weight and use RSI with a lower weight.
Total Score: The individual scores of the active analyses are multiplied by their assigned weights and summed up. This total is then divided by the sum of the weights of the active analyses to obtain a final, normalized Trend Score between -1.0 and +1.0. This score represents the combined view of all analyses.
4. Trend Determination:
The calculated final Trend Score is classified into an overall TREND status based on threshold values you set in the settings:
S.UP (Strong Up): Score > Strong Up Threshold (Default: 0.70)
UP: Up Threshold < Score <= Strong Up Threshold (Default: 0.35 < Score <= 0.70)
NEUTRAL: Down Threshold <= Score <= Up Threshold (Default: -0.35 <= Score <= 0.35)
DOWN: Strong Down Threshold <= Score < Down Threshold (Default: -0.70 <= Score < -0.35)
S.DOWN (Strong Down): Score < Strong Down Threshold (Default: -0.70)
This classification allows you to see at a glance which assets have strong trend potential.
5. Table Structure and Meanings:
The indicator displays the results in a table with the following columns:
TICKER: The symbol of the analyzed asset (abbreviated).
TREND: The overall trend status determined by the total score (S.UP, UP, NEUTRAL, DOWN, S.DOWN). The background color of this column also reflects this overall trend (Dark Green, Green, Gray, Red, Dark Red).
SCORE: The calculated weighted total score (between -1.00 and +1.00, with two decimal places). The background color of this column also reflects the overall trend.
EMA: Shows the result of only the EMA 9/21 analysis.
▲: EMA(9) > EMA(21) (Green Background)
▼: EMA(9) < EMA(21) (Red Background)
N: Neutral (Gray Background)
-: Analysis disabled or no data (Pale Gray Background)
RSI: Shows the result of only the RSI analysis.
OS: Oversold (RSI < 30) (Green Background)
M+: Mid Positive (30 <= RSI < 45) (Light Green/Lime Background)
N: Neutral (45 <= RSI <= 55) (Gray Background)
M-: Mid Negative (55 < RSI <= 70) (Orange Background)
OB: Overbought (RSI > 70) (Red Background)
-: Analysis disabled or no data (Pale Gray Background)
MACD: Shows the result of only the MACD analysis.
S+: Strong Positive (MACD > Signal AND Histogram > 0) (Green Background)
M+: Mid Positive (MACD > Signal BUT Histogram < 0) (Light Green/Lime Background)
N: Neutral (Other cases) (Gray Background)
M-: Mid Negative (MACD < Signal BUT Histogram > 0) (Orange Background)
S-: Strong Negative (MACD < Signal AND Histogram < 0) (Red Background)
-: Analysis disabled or no data (Pale Gray Background)
ADX/DI: Shows the result of only the ADX/DI analysis.
S+: Strong Uptrend (ADX > 40 AND +DI > -DI) (Green Background)
M+: Mid Uptrend (25 < ADX <= 40 AND +DI > -DI) (Light Green/Lime Background)
W: Weak Trend (ADX <= 25) (Gray Background)
M-: Mid Downtrend (25 < ADX <= 40 AND -DI > +DI) (Orange Background)
S-: Strong Downtrend (ADX > 40 AND -DI > +DI) (Red Background)
-: Analysis disabled or no data (Pale Gray Background)
6. Settings (Inputs):
You can customize the indicator's behavior using the following settings:
General Settings:
Analysis Timeframe: Select the timeframe for the scans (Leave blank to use the chart timeframe).
Auto Adjust Parameters and Weights: If checked, predefined parameters and weights based on the selected timeframe (1h, 4h, 1D, 1W) are used. If unchecked, or if an unsupported timeframe is selected, the manual settings below apply.
Strong/Normal Up/Down Thresholds: Adjust the score thresholds used to determine the TREND column.
Analysis Settings (Separate Group for Each Analysis):
Enable ... Analysis: Check to include the respective analysis in the score.
... Weight (Manual): If auto-adjust is off, set the weight of this analysis in the total score.
... Period/Level (Manual): If auto-adjust is off, adjust the parameters (period, level, etc.) of the respective indicator.
Symbols (1-10):
Checkbox: Check to include the respective symbol in the scan.
Text Box: Enter the symbol of the asset you want to analyze (e.g., "NASDAQ:AAPL", "BINANCE:BTCUSDT").
Table Settings:
Table Position: Choose where the table appears on the chart.
Cell Width: Adjust the width of the table cells.
Text Size: Select the general size of the text in the table (individual analysis columns are usually shown one size smaller).
7. How to Use:
Add the indicator to your TradingView chart.
Enter the indicator settings.
In the Symbols section, enter the symbols of the assets you want to analyze and check the boxes next to them.
In the General Settings section, select your desired Analysis Timeframe.
Decide whether the Auto Adjust Parameters and Weights option should be checked. If not, adjust the manual parameters and weights for each indicator in the Analysis Settings section according to your strategy.
Examine the table:
The TREND and SCORE columns give you a general overview. Focus on strong signals (S.UP, S.DOWN) or states that have just crossed thresholds (UP, DOWN).
The EMA, RSI, MACD, ADX/DI columns allow you to see in detail which analyses influenced the overall score. You can track confirming or conflicting signals here.
Combine these scan results with other rules of your swing trading strategy (support/resistance, patterns, risk management, etc.) to make trading decisions.
8. Important Notes:
This indicator does not constitute financial advice. It is merely a tool that combines technical analysis tools to help you scan the market.
The default parameters and weights in the indicator settings are for general use. For best results, it is strongly recommended that you optimize these settings by backtesting them on historical data according to your own strategy, the assets you trade, and market conditions.
No technical indicator or system generates 100% accurate signals. Always apply risk management principles and do not trade with money you cannot afford to lose.
I hope this guide helps you use the indicator effectively!

Indicator DashboardThis script creates an 'Indicator Dashboard' designed to assist you in analyzing financial markets and making informed decisions. The indicator provides a summary of current market conditions by presenting various technical analysis indicators in a table format. The dashboard evaluates popular indicators such as Moving Averages, RSI, MACD, and Stochastic RSI. Below, we'll explain each part of this script in detail and its purpose:
### Overview of Indicators
1. **Moving Averages (MA)**:
- This indicator calculates Simple Moving Averages (“SMA”) for 5, 14, 20, 50, 100, and 200 periods. These averages provide a visual summary of price movements. Depending on whether the price is above or below the moving average, it determines the market direction as either “Bullish” or “Bearish.”
2. **RSI (Relative Strength Index)**:
- The RSI helps identify overbought or oversold market conditions. Here, the RSI is calculated for a 14-period window, and this value is displayed in the table. Additionally, the 14-period moving average of the RSI is also included.
3. **MACD (Moving Average Convergence Divergence)**:
- The MACD indicator is used to determine trend strength and potential reversals. This script calculates the MACD line, signal line, and histogram. The MACD condition (“Bullish,” “Bearish,” or “Neutral”) is displayed alongside the MACD and signal line values.
4. **Stochastic RSI**:
- Stochastic RSI is used to identify momentum changes in the market. The %K and %D lines are calculated to determine the market condition (“Bullish” or “Bearish”), which is displayed along with the calculated values for %K and %D.
### Table Layout and Presentation
The dashboard is presented in a vertical table format in the top-right corner of the chart. The table contains two columns: “Indicator” and “Status,” summarizing the condition of each technical indicator.
- **Indicator Column**: Lists each of the indicators being tracked, such as SMA values, RSI, MACD, etc.
- **Status Column**: Displays the current status of each indicator, such as “Bullish,” “Bearish,” or specific values like the RSI or MACD.
The table also includes rounded indicator values for easier interpretation. This helps traders quickly assess market conditions and make informed decisions based on multiple indicators presented in a single location.
### Detailed Indicator Status Calculations
1. **SMA Status**: For each moving average (5, 14, 20, 50, 100, 200), the script checks if the current price is above or below the SMA. The status is determined as “Bullish” if the price is above the SMA and “Bearish” if below, with the value of the SMA also displayed.
2. **RSI and RSI Average**: The RSI value for a 14-period is displayed along with its 14-period SMA, which provides an average reading of the RSI to smooth out volatility.
3. **MACD Indicator**: The MACD line, signal line, and histogram are calculated using standard parameters (12, 26, 9). The status is shown as “Bullish” when the MACD line is above the signal line, and “Bearish” when it is below. The exact values for the MACD line, signal line, and histogram are also included.
4. **Stochastic RSI**: The %K and %D lines of the Stochastic RSI are used to determine the trend condition. If %K is greater than %D, the condition is “Bullish,” otherwise it is “Bearish.” The actual values of %K and %D are also displayed.
### Conclusion
The 'Indicator Dashboard' provides a comprehensive overview of multiple technical indicators in a single, easy-to-read table. This allows traders to quickly gauge market conditions and make more informed decisions. By consolidating key indicators like Moving Averages, RSI, MACD, and Stochastic RSI into one dashboard, it saves time and enhances the efficiency of technical analysis.
This script is particularly useful for traders who prefer a clean and organized overview of their favorite indicators without needing to plot each one individually on the chart. Instead, all the crucial information is available at a glance in a consolidated format.

Ichimoku + RSI + MACD Strategy1. Relative Strength Index (RSI)
Overview:
The Relative Strength Index (RSI) is a momentum oscillator that measures the speed and change of price movements. It ranges from 0 to 100 and is typically used to identify overbought or oversold conditions in a market.
How to Use with Ichimoku:
Long Entry: Look for RSI to be above 30 (indicating it is not oversold) when the price is above the Ichimoku Cloud.
Short Entry: Look for RSI to be below 70 (indicating it is not overbought) when the price is below the Ichimoku Cloud.
2. Moving Average Convergence Divergence (MACD)
Overview:
The MACD is a trend-following momentum indicator that shows the relationship between two moving averages of a security’s price. It consists of the MACD line, signal line, and histogram.
How to Use with Ichimoku:
Long Entry: Enter a long position when the MACD line crosses above the signal line while the price is above the Ichimoku Cloud.
Short Entry: Enter a short position when the MACD line crosses below the signal line while the price is below the Ichimoku Cloud.
Combined Strategy Example
Here’s a brief outline of how to structure a trading strategy using Ichimoku, RSI, and MACD:
Long Entry Conditions:
Price is above the Ichimoku Cloud.
RSI is above 30.
MACD line crosses above the signal line.
Short Entry Conditions:
Price is below the Ichimoku Cloud.
RSI is below 70.
MACD line crosses below the signal line.
Exit Conditions:
Exit long when MACD line crosses below the signal line.
Exit short when MACD line crosses above the signal line.

Custom Moving Average Ribbon with EMA Table & Text ColorComprehensive Description of the Custom Moving Average Ribbon with EMA Table & Text Color
The Custom Moving Average Ribbon with EMA Table & Text Color is a highly flexible and customizable indicator designed for traders who use multiple moving averages to assess trends, strength, and potential market reversals. It plots up to 8 moving averages (either SMA, EMA, WMA, or VWMA) on the price chart and displays a table summarizing the moving averages’ values, periods, and colors. The table also allows for the customization of the text color, making it easier to align with your chart’s theme or preference.
Key Features:
Multiple Moving Averages: You can display up to 8 moving averages (MA), each of which can be customized in terms of:
Type: SMA (Simple Moving Average), EMA (Exponential Moving Average), WMA (Weighted Moving Average), or VWMA (Volume-Weighted Moving Average).
Period: Each moving average has a user-defined period, which allows for flexibility depending on your trading style (short-term, medium-term, or long-term).
Enable/Disable: Each moving average can be independently enabled or disabled based on your preference.
Moving Average Ribbon: The indicator visualizes multiple moving averages as a ribbon, giving traders insight into the market's underlying trend. The interaction between these moving averages provides essential signals:
Uptrend: Shorter-term MAs above longer-term MAs, all sloping upward.
Downtrend: Shorter-term MAs below longer-term MAs, sloping downward.
Consolidation: MAs tightly packed, indicating low volatility or a sideways market.
Customizable Table: The indicator includes a table that displays:
The Name of each moving average (e.g., MA 1, MA 2, etc.).
The Period used for each moving average.
The Current Value of each moving average.
Color Coding for easier visual identification on the chart.
Text Color Customization: You can change the text color in the table to match your chart style or to ensure high visibility.
Responsive Design: This indicator works on any time frame, whether you're a day trader, swing trader, or long-term investor, and the table adjusts dynamically as new data comes in.
How to Use the Indicator
a) Trend Identification
The Custom Moving Average Ribbon helps in identifying trends and their strength. Here’s how you can interpret the plotted moving averages:
Uptrend (Bullish):
If the shorter-term moving averages (e.g., 5-period, 10-period) are above the longer-term moving averages (e.g., 50-period, 200-period), and all the MAs are sloping upward, it suggests a strong bullish trend.
The greater the separation between the moving averages, the stronger the uptrend.
Use the table to quickly verify the current value of each MA and confirm that the price is staying above most or all of the MAs.
Downtrend (Bearish):
When shorter-term moving averages are below the longer-term moving averages and all MAs are sloping downward, this indicates a bearish trend.
Greater separation between MAs indicates a stronger downtrend.
Neutral/Consolidating Market:
If the MAs are tightly packed and frequently crossing each other, the market is likely consolidating, and a strong trend is not in play.
In these situations, it’s better to wait for a clearer signal before taking any positions.
b) Reversal Signals
Golden Cross: When a short-term moving average (e.g., 50-period) crosses above a long-term moving average (e.g., 200-period), this is considered a bullish signal, suggesting a possible upward trend.
Death Cross: When a short-term moving average crosses below a long-term moving average, it’s considered a bearish signal, indicating a potential downward trend.
c) Using the Table for Quick Reference
The table allows you to monitor:
The current price value relative to each moving average. If the price is above most MAs, the market is likely in an uptrend, and if below, in a downtrend.
Changes in MA values: If you see values of shorter-term MAs moving closer to or crossing longer-term MAs, this could indicate a weakening trend or a potential reversal.
How to Combine this Indicator with Other Indicators for a Solid Strategy
The Custom Moving Average Ribbon is powerful on its own but can be enhanced when combined with other technical indicators to form a comprehensive trading strategy.
1. Combining with RSI (Relative Strength Index)
How It Works: RSI is a momentum oscillator that measures the speed and change of price movements, typically over 14 periods. It ranges from 0 to 100, with readings above 70 considered overbought and below 30 considered oversold.
Strategy:
Overbought in an Uptrend: If the moving average ribbon indicates an uptrend but the RSI shows the market is overbought (RSI > 70), it could signal a pullback or correction is imminent.
Oversold in a Downtrend: If the moving average ribbon indicates a downtrend but the RSI shows oversold conditions (RSI < 30), a bounce or reversal may be on the horizon.
2. Combining with MACD (Moving Average Convergence Divergence)
How It Works: MACD tracks the difference between two exponential moving averages, typically the 12-period and 26-period EMAs. It generates buy and sell signals based on crossovers and divergences.
Strategy:
Trend Confirmation: Use the MACD to confirm the direction and momentum of the trend indicated by the moving average ribbon. For example, if the MACD line crosses above the signal line while the shorter-term MAs are above the longer-term MAs, it confirms strong bullish momentum.
Divergences: Watch for divergences between price action and MACD. If price is making higher highs but MACD is making lower highs, it could signal a weakening trend, which you can verify using the moving averages.
3. Combining with Bollinger Bands
How It Works: Bollinger Bands plot two standard deviations above and below a moving average, typically the 20-period SMA. The bands widen during periods of high volatility and contract during periods of low volatility.
Strategy:
Breakout or Reversal: If price action moves above the upper Bollinger Band while the shorter-term MAs are crossing above the longer-term MAs, it confirms a strong breakout. Conversely, if price touches or falls below the lower Bollinger Band and the shorter MAs start crossing below the longer-term MAs, it indicates a potential breakdown.
Mean Reversion: In sideways markets, when the moving averages are tightly packed, Bollinger Bands can help spot mean reversion opportunities (buy near the lower band, sell near the upper band).
4. Combining with Volume Indicators
How It Works: Volume is a crucial confirmation indicator for any trend or breakout. Combining volume with the moving average ribbon can enhance your strategy.
Strategy:
Trend Confirmation: If the price breaks above the moving averages and is accompanied by high volume, it confirms a strong breakout. Similarly, if price breaks below the moving averages on high volume, it signals a strong downtrend.
Divergence: If price continues to trend in one direction but volume decreases, it could indicate a weakening trend, helping you prepare for a reversal.
Example Strategies Using the Indicator
Trend-Following Strategy:
Use the moving average ribbon to identify the main trend.
Combine with MACD or RSI for confirmation of momentum.
Enter trades when the shorter-term MAs confirm the trend and the confirmation indicator (MACD or RSI) aligns with the trend.
Exit trades when the moving averages start converging or when your confirmation indicator shows signs of reversal.
Reversal Strategy:
Wait for significant crossovers in the moving averages (Golden Cross or Death Cross).
Confirm the reversal with divergence in MACD or RSI.
Use Bollinger Bands to fine-tune your entry and exit points based on overbought/oversold conditions.
Conclusion
The Custom Moving Average Ribbon with EMA Table & Text Color indicator provides a robust framework for traders looking to use multiple moving averages to gauge trend direction, strength, and potential reversals. By combining it with other technical indicators like RSI, MACD, Bollinger Bands, and volume, you can develop a solid trading strategy that enhances accuracy, reduces false signals, and maximizes profit potential in various market conditions.
This indicator offers high flexibility with customization options, making it suitable for traders of all levels and strategies. Whether you're trend-following, scalping, or swing trading, this tool provides invaluable insights into market movements.

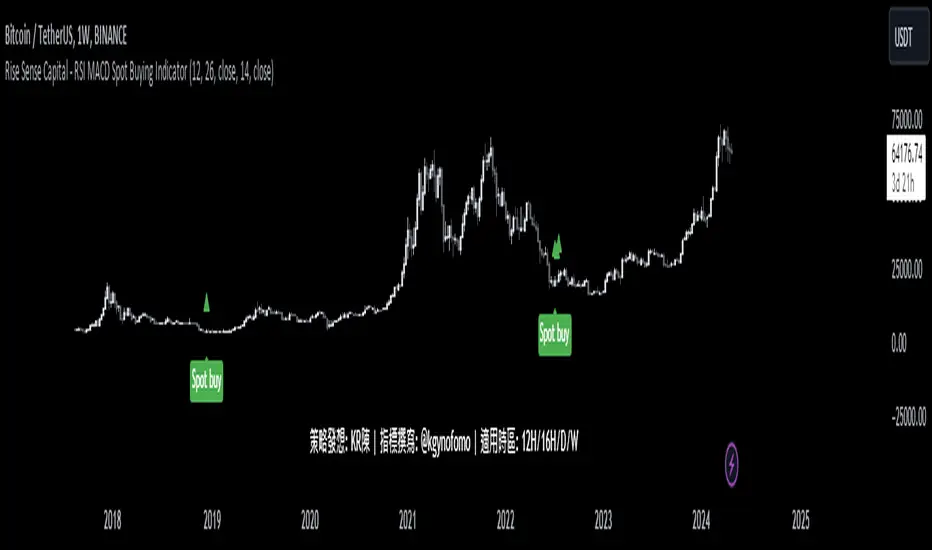
Rise Sense Capital - RSI MACD Spot Buying IndicatorToday, I'll share a spot buying strategy shared by a member @KR陳 within the DATA Trader Alliance Alpha group. First, you need to prepare two indicators:
今天分享一個DATA交易者聯盟Alpha群組裏面的群友@KR陳分享的現貨買入策略。
首先需要準備兩個指標
RSI Indicator (Relative Strength Index) - RSI is a technical analysis tool based on price movements over a period of time to evaluate the speed and magnitude of price changes. RSI calculates the changes in price over a period to determine whether the recent trend is relatively strong (bullish) or weak (bearish).
RSI指標,(英文全名:Relative Strength Index),中文稱為「相對強弱指標」,是一種以股價漲跌為基礎,在一段時間內的收盤價,用於評估價格變動的速度 (快慢) 與變化 (幅度) 的技術分析工具,RSI藉由計算一段期間內股價的漲跌變化,判斷最近的趨勢屬於偏強 (偏多) 還是偏弱 (偏空)。
MACD Indicator (Moving Average Convergence & Divergence) - MACD is a technical analysis tool proposed by Gerald Appel in the 1970s. It is commonly used in trading to determine trend reversals by analyzing the convergence and divergence of fast and slow lines.
MACD 指標 (Moving Average Convergence & Divergence) 中文名為平滑異同移動平均線指標,MACD 是在 1970 年代由美國人 Gerald Appel 所提出,是一項歷史悠久且經常在交易中被使用的技術分析工具,原理是利用快慢線的交錯,藉以判斷股價走勢的轉折。
In MACD analysis, the most commonly used values are 12, 26, and 9, known as MACD (12,26,9). The market often uses the MACD indicator to determine the future direction of assets and to identify entry and exit points.
在 MACD 的技術分析中,最常用的值為 12 天、26 天、9 天,也稱為 MACD (12,26,9),市場常用 MACD 指標來判斷操作標的的後市走向,確定波段漲幅並找到進、出場點。
Strategy analysis by member KR陳:
策略解析 by群友 KR陳 :
Condition 1: RSI value in the previous candle is below oversold zone(30).
條件1:RSI 在前一根的數值低於超賣區(30)
buycondition1 = RSI <30
Condition 2: MACD histogram changes from decreasing to increasing.
條件2:MACD柱由遞減轉遞增
buycondition2 = hist >hist and hist <hist
Strategy Effect Display:
策略效果展示:
Slight modification:
稍微修改:
I've added the ATR-MACD, developed earlier, as a filter signal alongside the classic MACD. The appearance of an upward-facing triangle indicates that the ATR MACD histogram also triggers the condition, aiming to serve as a filtering mechanism.
我在經典的macd作爲條件的同時 也加入了之前開發的ATR-MACD作爲過濾信號 出現朝上的三角圖示代表ATR MACD的柱狀圖一樣觸發條件 希望可以以此起到過濾的作用
Asset/Usage Instructions:
使用標的/使用説明
Through backtesting, it's found that it's not suitable for smaller time frames as there's a lot of noise. It's recommended to use it in assets with a long-term bullish view, focusing on time frames of 12 hours or longer such as 12H, 16H, 1D, 1W to find spot buying opportunities.
經過回測發現 并不適用與一些小級別時區 噪音會非常多,建議在一些長期看漲的標的中切入12小時以上的時區如12H,16H, 1D, 1W 中間尋找現貨買入的機會。
A few thoughts:
Overall, it's a very good indicator strategy for spot buying in the physical market. Thanks to member @KR陳 for sharing!
一些小感言 綜合來看是一個針對現貨買入非常好的指標策略,感謝群友@KR陳的分享!
Supertrend Advance Pullback StrategyHandbook for the Supertrend Advance Strategy
1. Introduction
Purpose of the Handbook:
The main purpose of this handbook is to serve as a comprehensive guide for traders and investors who are looking to explore and harness the potential of the Supertrend Advance Strategy. In the rapidly changing financial market, having the right tools and strategies at one's disposal is crucial. Whether you're a beginner hoping to dive into the world of trading or a seasoned investor aiming to optimize and diversify your portfolio, this handbook offers the insights and methodologies you need. By the end of this guide, readers should have a clear understanding of how the Supertrend Advance Strategy works, its benefits, potential pitfalls, and practical application in various trading scenarios.
Overview of the Supertrend Advance Pullback Strategy:
At its core, the Supertrend Advance Strategy is an evolution of the popular Supertrend Indicator. Designed to generate buy and sell signals in trending markets, the Supertrend Indicator has been a favorite tool for many traders around the world. The Advance Strategy, however, builds upon this foundation by introducing enhanced mechanisms, filters, and methodologies to increase precision and reduce false signals.
1. Basic Concept:
The Supertrend Advance Strategy relies on a combination of price action and volatility to determine the potential trend direction. By assessing the average true range (ATR) in conjunction with specific price points, this strategy aims to highlight the potential starting and ending points of market trends.
2. Methodology:
Unlike the traditional Supertrend Indicator, which primarily focuses on closing prices and ATR, the Advance Strategy integrates other critical market variables, such as volume, momentum oscillators, and perhaps even fundamental data, to validate its signals. This multidimensional approach ensures that the generated signals are more reliable and are less prone to market noise.
3. Benefits:
One of the main benefits of the Supertrend Advance Strategy is its ability to filter out false breakouts and minor price fluctuations, which can often lead to premature exits or entries in the market. By waiting for a confluence of factors to align, traders using this advanced strategy can increase their chances of entering or exiting trades at optimal points.
4. Practical Applications:
The Supertrend Advance Strategy can be applied across various timeframes, from intraday trading to swing trading and even long-term investment scenarios. Furthermore, its flexible nature allows it to be tailored to different asset classes, be it stocks, commodities, forex, or cryptocurrencies.
In the subsequent sections of this handbook, we will delve deeper into the intricacies of this strategy, offering step-by-step guidelines on its application, case studies, and tips for maximizing its efficacy in the volatile world of trading.
As you journey through this handbook, we encourage you to approach the Supertrend Advance Strategy with an open mind, testing and tweaking it as per your personal trading style and risk appetite. The ultimate goal is not just to provide you with a new tool but to empower you with a holistic strategy that can enhance your trading endeavors.
2. Getting Started
Navigating the financial markets can be a daunting task without the right tools. This section is dedicated to helping you set up the Supertrend Advance Strategy on one of the most popular charting platforms, TradingView. By following the steps below, you'll be able to integrate this strategy into your charts and start leveraging its insights in no time.
Setting up on TradingView:
TradingView is a web-based platform that offers a wide range of charting tools, social networking, and market data. Before you can apply the Supertrend Advance Strategy, you'll first need a TradingView account. If you haven't set one up yet, here's how:
1. Account Creation:
• Visit TradingView's official website.
• Click on the "Join for free" or "Sign up" button.
• Follow the registration process, providing the necessary details and setting up your login credentials.
2. Navigating the Dashboard:
• Once logged in, you'll be taken to your dashboard. Here, you'll see a variety of tools, including watchlists, alerts, and the main charting window.
• To begin charting, type in the name or ticker of the asset you're interested in the search bar at the top.
3. Configuring Chart Settings:
• Before integrating the Supertrend Advance Strategy, familiarize yourself with the chart settings. This can be accessed by clicking the 'gear' icon on the top right of the chart window.
• Adjust the chart type, time intervals, and other display settings to your preference.
Integrating the Strategy into a Chart:
Now that you're set up on TradingView, it's time to integrate the Supertrend Advance Strategy.
1. Accessing the Pine Script Editor:
• Located at the top-center of your screen, you'll find the "Pine Editor" tab. Click on it.
• This is where custom strategies and indicators are scripted or imported.
2. Loading the Supertrend Advance Strategy Script:
• Depending on whether you have the script or need to find it, there are two paths:
• If you have the script: Copy the Supertrend Advance Strategy script, and then paste it into the Pine Editor.
• If searching for the script: Click on the “Indicators” icon (looks like a flame) at the top of your screen, and then type “Supertrend Advance Strategy” in the search bar. If available, it will show up in the list. Simply click to add it to your chart.
3. Applying the Strategy:
• After pasting or selecting the Supertrend Advance Strategy in the Pine Editor, click on the “Add to Chart” button located at the top of the editor. This will overlay the strategy onto your main chart window.
4. Configuring Strategy Settings:
• Once the strategy is on your chart, you'll notice a small settings ('gear') icon next to its name in the top-left of the chart window. Click on this to access settings.
• Here, you can adjust various parameters of the Supertrend Advance Strategy to better fit your trading style or the specific asset you're analyzing.
5. Interpreting Signals:
• With the strategy applied, you'll now see buy/sell signals represented on your chart. Take time to familiarize yourself with how these look and behave over various timeframes and market conditions.
3. Strategy Overview
What is the Supertrend Advance Strategy?
The Supertrend Advance Strategy is a refined version of the classic Supertrend Indicator, which was developed to aid traders in spotting market trends. The strategy utilizes a combination of data points, including average true range (ATR) and price momentum, to generate buy and sell signals.
In essence, the Supertrend Advance Strategy can be visualized as a line that moves with the price. When the price is above the Supertrend line, it indicates an uptrend and suggests a potential buy position. Conversely, when the price is below the Supertrend line, it hints at a downtrend, suggesting a potential selling point.
Strategy Goals and Objectives:
1. Trend Identification: At the core of the Supertrend Advance Strategy is the goal to efficiently and consistently identify prevailing market trends. By recognizing these trends, traders can position themselves to capitalize on price movements in their favor.
2. Reducing Noise: Financial markets are often inundated with 'noise' - short-term price fluctuations that can mislead traders. The Supertrend Advance Strategy aims to filter out this noise, allowing for clearer decision-making.
3. Enhancing Risk Management: With clear buy and sell signals, traders can set more precise stop-loss and take-profit points. This leads to better risk management and potentially improved profitability.
4. Versatility: While primarily used for trend identification, the strategy can be integrated with other technical tools and indicators to create a comprehensive trading system.
Type of Assets/Markets to Apply the Strategy:
1. Equities: The Supertrend Advance Strategy is highly popular among stock traders. Its ability to capture long-term trends makes it particularly useful for those trading individual stocks or equity indices.
2. Forex: Given the 24-hour nature of the Forex market and its propensity for trends, the Supertrend Advance Strategy is a valuable tool for currency traders.
3. Commodities: Whether it's gold, oil, or agricultural products, commodities often move in extended trends. The strategy can help in identifying and capitalizing on these movements.
4. Cryptocurrencies: The volatile nature of cryptocurrencies means they can have pronounced trends. The Supertrend Advance Strategy can aid crypto traders in navigating these often tumultuous waters.
5. Futures & Options: Traders and investors in derivative markets can utilize the strategy to make more informed decisions about contract entries and exits.
It's important to note that while the Supertrend Advance Strategy can be applied across various assets and markets, its effectiveness might vary based on market conditions, timeframe, and the specific characteristics of the asset in question. As always, it's recommended to use the strategy in conjunction with other analytical tools and to backtest its effectiveness in specific scenarios before committing to trades.
4. Input Settings
Understanding and correctly configuring input settings is crucial for optimizing the Supertrend Advance Strategy for any specific market or asset. These settings, when tweaked correctly, can drastically impact the strategy's performance.
Grouping Inputs:
Before diving into individual input settings, it's important to group similar inputs. Grouping can simplify the user interface, making it easier to adjust settings related to a specific function or indicator.
Strategy Choice:
This input allows traders to select from various strategies that incorporate the Supertrend indicator. Options might include "Supertrend with RSI," "Supertrend with MACD," etc. By choosing a strategy, the associated input settings for that strategy become available.
Supertrend Settings:
1. Multiplier: Typically, a default value of 3 is used. This multiplier is used in the ATR calculation. Increasing it makes the Supertrend line further from prices, while decreasing it brings the line closer.
2. Period: The number of bars used in the ATR calculation. A common default is 7.
EMA Settings (Exponential Moving Average):
1. Period: Defines the number of previous bars used to calculate the EMA. Common periods are 9, 21, 50, and 200.
2. Source: Allows traders to choose which price (Open, Close, High, Low) to use in the EMA calculation.
RSI Settings (Relative Strength Index):
1. Length: Determines how many periods are used for RSI calculation. The standard setting is 14.
2. Overbought Level: The threshold at which the asset is considered overbought, typically set at 70.
3. Oversold Level: The threshold at which the asset is considered oversold, often at 30.
MACD Settings (Moving Average Convergence Divergence):
1. Short Period: The shorter EMA, usually set to 12.
2. Long Period: The longer EMA, commonly set to 26.
3. Signal Period: Defines the EMA of the MACD line, typically set at 9.
CCI Settings (Commodity Channel Index):
1. Period: The number of bars used in the CCI calculation, often set to 20.
2. Overbought Level: Typically set at +100, denoting overbought conditions.
3. Oversold Level: Usually set at -100, indicating oversold conditions.
SL/TP Settings (Stop Loss/Take Profit):
1. SL Multiplier: Defines the multiplier for the average true range (ATR) to set the stop loss.
2. TP Multiplier: Defines the multiplier for the average true range (ATR) to set the take profit.
Filtering Conditions:
This section allows traders to set conditions to filter out certain signals. For example, one might only want to take buy signals when the RSI is below 30, ensuring they buy during oversold conditions.
Trade Direction and Backtest Period:
1. Trade Direction: Allows traders to specify whether they want to take long trades, short trades, or both.
2. Backtest Period: Specifies the time range for backtesting the strategy. Traders can choose from options like 'Last 6 months,' 'Last 1 year,' etc.
It's essential to remember that while default settings are provided for many of these tools, optimal settings can vary based on the market, timeframe, and trading style. Always backtest new settings on historical data to gauge their potential efficacy.
5. Understanding Strategy Conditions
Developing an understanding of the conditions set within a trading strategy is essential for traders to maximize its potential. Here, we delve deep into the logic behind these conditions, using the Supertrend Advance Strategy as our focal point.
Basic Logic Behind Conditions:
Every strategy is built around a set of conditions that provide buy or sell signals. The conditions are based on mathematical or statistical methods and are rooted in the study of historical price data. The fundamental idea is to recognize patterns or behaviors that have been profitable in the past and might be profitable in the future.
Buy and Sell Conditions:
1. Buy Conditions: Usually formulated around bullish signals or indicators suggesting upward price momentum.
2. Sell Conditions: Centered on bearish signals or indicators indicating downward price momentum.
Simple Strategy:
The simple strategy could involve using just the Supertrend indicator. Here:
• Buy: When price closes above the Supertrend line.
• Sell: When price closes below the Supertrend line.
Pullback Strategy:
This strategy capitalizes on price retracements:
• Buy: When the price retraces to the Supertrend line after a bullish signal and is supported by another bullish indicator.
• Sell: When the price retraces to the Supertrend line after a bearish signal and is confirmed by another bearish indicator.
Indicators Used:
EMA (Exponential Moving Average):
• Logic: EMA gives more weight to recent prices, making it more responsive to current price movements. A shorter-period EMA crossing above a longer-period EMA can be a bullish sign, while the opposite is bearish.
RSI (Relative Strength Index):
• Logic: RSI measures the magnitude of recent price changes to analyze overbought or oversold conditions. Values above 70 are typically considered overbought, and values below 30 are considered oversold.
MACD (Moving Average Convergence Divergence):
• Logic: MACD assesses the relationship between two EMAs of a security’s price. The MACD line crossing above the signal line can be a bullish signal, while crossing below can be bearish.
CCI (Commodity Channel Index):
• Logic: CCI compares a security's average price change with its average price variation. A CCI value above +100 may mean the price is overbought, while below -100 might signify an oversold condition.
And others...
As the strategy expands or contracts, more indicators might be added or removed. The crucial point is to understand the core logic behind each, ensuring they align with the strategy's objectives.
Logic Behind Each Indicator:
1. EMA: Emphasizes recent price movements; provides dynamic support and resistance levels.
2. RSI: Indicates overbought and oversold conditions based on recent price changes.
3. MACD: Showcases momentum and direction of a trend by comparing two EMAs.
4. CCI: Measures the difference between a security's price change and its average price change.
Understanding strategy conditions is not just about knowing when to buy or sell but also about comprehending the underlying market dynamics that those conditions represent. As you familiarize yourself with each condition and indicator, you'll be better prepared to adapt and evolve with the ever-changing financial markets.
6. Trade Execution and Management
Trade execution and management are crucial aspects of any trading strategy. Efficient execution can significantly impact profitability, while effective management can preserve capital during adverse market conditions. In this section, we'll explore the nuances of position entry, exit strategies, and various Stop Loss (SL) and Take Profit (TP) methodologies within the Supertrend Advance Strategy.
Position Entry:
Effective trade entry revolves around:
1. Timing: Enter at a point where the risk-reward ratio is favorable. This often corresponds to confirmatory signals from multiple indicators.
2. Volume Analysis: Ensure there's adequate volume to support the movement. Volume can validate the strength of a signal.
3. Confirmation: Use multiple indicators or chart patterns to confirm the entry point. For instance, a buy signal from the Supertrend indicator can be confirmed with a bullish MACD crossover.
Position Exit Strategies:
A successful exit strategy will lock in profits and minimize losses. Here are some strategies:
1. Fixed Time Exit: Exiting after a predetermined period.
2. Percentage-based Profit Target: Exiting after a certain percentage gain.
3. Indicator-based Exit: Exiting when an indicator gives an opposing signal.
Percentage-based SL/TP:
• Stop Loss (SL): Set a fixed percentage below the entry price to limit potential losses.
• Example: A 2% SL on an entry at $100 would trigger a sell at $98.
• Take Profit (TP): Set a fixed percentage above the entry price to lock in gains.
• Example: A 5% TP on an entry at $100 would trigger a sell at $105.
Supertrend-based SL/TP:
• Stop Loss (SL): Position the SL at the Supertrend line. If the price breaches this line, it could indicate a trend reversal.
• Take Profit (TP): One could set the TP at a point where the Supertrend line flattens or turns, indicating a possible slowdown in momentum.
Swing high/low-based SL/TP:
• Stop Loss (SL): For a long position, set the SL just below the recent swing low. For a short position, set it just above the recent swing high.
• Take Profit (TP): For a long position, set the TP near a recent swing high or resistance. For a short position, near a swing low or support.
And other methods...
1. Trailing Stop Loss: This dynamic SL adjusts with the price movement, locking in profits as the trade moves in your favor.
2. Multiple Take Profits: Divide the position into segments and set multiple TP levels, securing profits in stages.
3. Opposite Signal Exit: Exit when another reliable indicator gives an opposite signal.
Trade execution and management are as much an art as they are a science. They require a blend of analytical skill, discipline, and intuition. Regularly reviewing and refining your strategies, especially in light of changing market conditions, is crucial to maintaining consistent trading performance.
7. Visual Representations
Visual tools are essential for traders, as they simplify complex data into an easily interpretable format. Properly analyzing and understanding the plots on a chart can provide actionable insights and a more intuitive grasp of market conditions. In this section, we’ll delve into various visual representations used in the Supertrend Advance Strategy and their significance.
Understanding Plots on the Chart:
Charts are the primary visual aids for traders. The arrangement of data points, lines, and colors on them tell a story about the market's past, present, and potential future moves.
1. Data Points: These represent individual price actions over a specific timeframe. For instance, a daily chart will have data points showing the opening, closing, high, and low prices for each day.
2. Colors: Used to indicate the nature of price movement. Commonly, green is used for bullish (upward) moves and red for bearish (downward) moves.
Trend Lines:
Trend lines are straight lines drawn on a chart that connect a series of price points. Their significance:
1. Uptrend Line: Drawn along the lows, representing support. A break below might indicate a trend reversal.
2. Downtrend Line: Drawn along the highs, indicating resistance. A break above might suggest the start of a bullish trend.
Filled Areas:
These represent a range between two values on a chart, usually shaded or colored. For instance:
1. Bollinger Bands: The area between the upper and lower band is filled, giving a visual representation of volatility.
2. Volume Profile: Can show a filled area representing the amount of trading activity at different price levels.
Stop Loss and Take Profit Lines:
These are horizontal lines representing pre-determined exit points for trades.
1. Stop Loss Line: Indicates the level at which a trade will be automatically closed to limit losses. Positioned according to the trader's risk tolerance.
2. Take Profit Line: Denotes the target level to lock in profits. Set according to potential resistance (for long trades) or support (for short trades) or other technical factors.
Trailing Stop Lines:
A trailing stop is a dynamic form of stop loss that moves with the price. On a chart:
1. For Long Trades: Starts below the entry price and moves up with the price but remains static if the price falls, ensuring profits are locked in.
2. For Short Trades: Starts above the entry price and moves down with the price but remains static if the price rises.
Visual representations offer traders a clear, organized view of market dynamics. Familiarity with these tools ensures that traders can quickly and accurately interpret chart data, leading to more informed decision-making. Always ensure that the visual aids used resonate with your trading style and strategy for the best results.
8. Backtesting
Backtesting is a fundamental process in strategy development, enabling traders to evaluate the efficacy of their strategy using historical data. It provides a snapshot of how the strategy would have performed in past market conditions, offering insights into its potential strengths and vulnerabilities. In this section, we'll explore the intricacies of setting up and analyzing backtest results and the caveats one must be aware of.
Setting Up Backtest Period:
1. Duration: Determine the timeframe for the backtest. It should be long enough to capture various market conditions (bullish, bearish, sideways). For instance, if you're testing a daily strategy, consider a period of several years.
2. Data Quality: Ensure the data source is reliable, offering high-resolution and clean data. This is vital to get accurate backtest results.
3. Segmentation: Instead of a continuous period, sometimes it's helpful to backtest over distinct market phases, like a particular bear or bull market, to see how the strategy holds up in different environments.
Analyzing Backtest Results:
1. Performance Metrics: Examine metrics like the total return, annualized return, maximum drawdown, Sharpe ratio, and others to gauge the strategy's efficiency.
2. Win Rate: It's the ratio of winning trades to total trades. A high win rate doesn't always signify a good strategy; it should be evaluated in conjunction with other metrics.
3. Risk/Reward: Understand the average profit versus the average loss per trade. A strategy might have a low win rate but still be profitable if the average gain far exceeds the average loss.
4. Drawdown Analysis: Review the periods of losses the strategy could incur and how long it takes, on average, to recover.
9. Tips and Best Practices
Successful trading requires more than just knowing how a strategy works. It necessitates an understanding of when to apply it, how to adjust it to varying market conditions, and the wisdom to recognize and avoid common pitfalls. This section offers insightful tips and best practices to enhance the application of the Supertrend Advance Strategy.
When to Use the Strategy:
1. Market Conditions: Ideally, employ the Supertrend Advance Strategy during trending market conditions. This strategy thrives when there are clear upward or downward trends. It might be less effective during consolidative or sideways markets.
2. News Events: Be cautious around significant news events, as they can cause extreme volatility. It might be wise to avoid trading immediately before and after high-impact news.
3. Liquidity: Ensure you are trading in assets/markets with sufficient liquidity. High liquidity ensures that the price movements are more reflective of genuine market sentiment and not due to thin volume.
Adjusting Settings for Different Markets/Timeframes:
1. Markets: Each market (stocks, forex, commodities) has its own characteristics. It's essential to adjust the strategy's parameters to align with the market's volatility and liquidity.
2. Timeframes: Shorter timeframes (like 1-minute or 5-minute charts) tend to have more noise. You might need to adjust the settings to filter out false signals. Conversely, for longer timeframes (like daily or weekly charts), you might need to be more responsive to genuine trend changes.
3. Customization: Regularly review and tweak the strategy's settings. Periodic adjustments can ensure the strategy remains optimized for the current market conditions.
10. Frequently Asked Questions (FAQs)
Given the complexities and nuances of the Supertrend Advance Strategy, it's only natural for traders, both new and seasoned, to have questions. This section addresses some of the most commonly asked questions regarding the strategy.
1. What exactly is the Supertrend Advance Strategy?
The Supertrend Advance Strategy is an evolved version of the traditional Supertrend indicator. It's designed to provide clearer buy and sell signals by incorporating additional indicators like EMA, RSI, MACD, CCI, etc. The strategy aims to capitalize on market trends while minimizing false signals.
2. Can I use the Supertrend Advance Strategy for all asset types?
Yes, the strategy can be applied to various asset types like stocks, forex, commodities, and cryptocurrencies. However, it's crucial to adjust the settings accordingly to suit the specific characteristics and volatility of each asset type.
3. Is this strategy suitable for day trading?
Absolutely! The Supertrend Advance Strategy can be adjusted to suit various timeframes, making it versatile for both day trading and long-term trading. Remember to fine-tune the settings to align with the timeframe you're trading on.
4. How do I deal with false signals?
No strategy is immune to false signals. However, by combining the Supertrend with other indicators and adhering to strict risk management protocols, you can minimize the impact of false signals. Always use stop-loss orders and consider filtering trades with additional confirmation signals.
5. Do I need any prior trading experience to use this strategy?
While the Supertrend Advance Strategy is designed to be user-friendly, having a foundational understanding of trading and market analysis can greatly enhance your ability to employ the strategy effectively. If you're a beginner, consider pairing the strategy with further education and practice on demo accounts.
6. How often should I review and adjust the strategy settings?
There's no one-size-fits-all answer. Some traders adjust settings weekly, while others might do it monthly. The key is to remain responsive to changing market conditions. Regular backtesting can give insights into potential required adjustments.
7. Can the Supertrend Advance Strategy be automated?
Yes, many traders use algorithmic trading platforms to automate their strategies, including the Supertrend Advance Strategy. However, always monitor automated systems regularly to ensure they're operating as intended.
8. Are there any markets or conditions where the strategy shouldn't be used?
The strategy might generate more false signals in markets that are consolidative or range-bound. During significant news events or times of unexpected high volatility, it's advisable to tread with caution or stay out of the market.
9. How important is backtesting with this strategy?
Backtesting is crucial as it allows traders to understand how the strategy would have performed in the past, offering insights into potential profitability and areas of improvement. Always backtest any new setting or tweak before applying it to live trades.
10. What if the strategy isn't working for me?
No strategy guarantees consistent profits. If it's not working for you, consider reviewing your settings, seeking expert advice, or complementing the Supertrend Advance Strategy with other analysis methods. Remember, continuous learning and adaptation are the keys to trading success.
Other comments
Value of combining several indicators in this script and how they work together
Diversification of Signals: Just as diversifying an investment portfolio can reduce risk, using multiple indicators can offer varied perspectives on potential price movements. Each indicator can capture a different facet of the market, ensuring that traders are not overly reliant on a single data point.
Confirmation & Reduced False Signals: A common challenge with many indicators is the potential for false signals. By requiring confirmation from multiple indicators before acting, the chances of acting on a false signal can be significantly reduced.
Flexibility Across Market Conditions: Different indicators might perform better under different market conditions. For example, while moving averages might excel in trending markets, oscillators like RSI might be more useful during sideways or range-bound conditions. A mashup strategy can potentially adapt better to varying market scenarios.
Comprehensive Analysis: With multiple indicators, traders can gauge trend strength, momentum, volatility, and potential market reversals all at once, providing a holistic view of the market.
How do the different indicators in the Supertrend Advance Strategy work together?
Supertrend: This is primarily a trend-following indicator. It provides traders with buy and sell signals based on the volatility of the price. When combined with other indicators, it can filter out noise and give more weight to strong, confirmed trends.
EMA (Exponential Moving Average): EMA gives more weight to recent price data. It can be used to identify the direction and strength of a trend. When the price is above the EMA, it's generally considered bullish, and vice versa.
RSI (Relative Strength Index): An oscillator that measures the magnitude of recent price changes to evaluate overbought or oversold conditions. By cross-referencing with other indicators like EMA or MACD, traders can spot potential reversals or confirmations of a trend.
MACD (Moving Average Convergence Divergence): This indicator identifies changes in the strength, direction, momentum, and duration of a trend in a stock's price. When the MACD line crosses above the signal line, it can be a bullish sign, and when it crosses below, it can be bearish. Pairing MACD with Supertrend can provide dual confirmation of a trend.
CCI (Commodity Channel Index): Initially developed for commodities, CCI can indicate overbought or oversold conditions. It can be used in conjunction with other indicators to determine entry and exit points.
In essence, the synergy of these indicators provides a balanced, comprehensive approach to trading. Each indicator offers its unique lens into market conditions, and when they align, it can be a powerful indication of a trading opportunity. This combination not only reduces the potential drawbacks of each individual indicator but leverages their strengths, aiming for more consistent and informed trading decisions.
Backtesting and Default Settings
• This indicator has been optimized to be applied for 1 hour-charts. However, the underlying principles of this strategy are supply and demand in the financial markets and the strategy can be applied to all timeframes. Daytraders can use the 1min- or 5min charts, swing-traders can use the daily charts.
• This strategy has been designed to identify the most promising, highest probability entries and trades for each stock or other financial security.
• The combination of the qualifiers results in a highly selective strategy which only considers the most promising swing-trading entries. As a result, you will normally only find a low number of trades for each stock or other financial security per year in case you apply this strategy for the daily charts. Shorter timeframes will result in a higher number of trades / year.
• Consequently, traders need to apply this strategy for a full watchlist rather than just one financial security.
• Default properties: RSI on (length 14, RSI buy level 50, sell level 50), EMA, RSI, MACD on, type of strategy pullback, SL/TP type: ATR (length 10, factor 3), trade direction both, quantity 5, take profit swing hl 5.1, highest / lowest lookback 2, enable ATR trail (ATR length 10, SL ATR multiplier 1.4, TP multiplier 2.1, lookback = 4, trade direction = both).

Fiboborsa+BistTitle: "Fiboborsa+Bist Indicator for TradingView"
Description: The "Fiboborsa+Bist" indicator is a powerful tool designed for TradingView users. This indicator offers a comprehensive set of technical indicators to assist you in your technical analysis and trading decisions.
Features:
Simple Moving Averages (SMA): You can enable or disable SMA with different periods (20, 50, 100, 200) to observe different timeframes and trends.
SMA Strategy: Use SMA crossovers to determine trends. Watch for the 20-period SMA crossing above the 50-period SMA for a bullish signal. For a bearish signal, observe the 50-period SMA crossing below the 100-period SMA.
Exponential Moving Averages (EMA): Similar to SMA, you can enable or disable EMA with different periods (5, 8, 14, 21, 34, 55, 89, 144, 233) for more precise trend analysis.
EMA Strategy: Use EMA crossovers and crossunders for short-term trend changes. A buy signal may occur when the 5-period EMA crosses above the 14-period EMA, while a crossunder suggests a selling opportunity.
Weighted Moving Averages (WMA): Customize WMA settings with various periods (5, 13, 21, 34, 89, 144, 233, 377, 610, 987) to suit your trading style.
WMA Strategy: Use WMA crossovers to verify trends. When the 13-period WMA crosses above the 34-period WMA, it may indicate an uptrend.
Buy and Sell Signals: The indicator provides buy and sell signals based on EMA crossovers and crossunders. Strong signals are also highlighted.
EMA Buy and Sell Strategy: Make informed trading decisions using buy and sell signals generated by EMA crossovers and crossunders.
Ichimoku Cloud: You can enable the Ichimoku Cloud for a clear visual representation of support and resistance levels.
Ichimoku Strategy: Use the Ichimoku Cloud to determine trend direction. Entering long positions is common when the price is above the cloud and considering short positions when it's below the cloud. Verify the trend with the Chikou Span.
Bollinger Bands: Easily visualize price volatility by enabling the Bollinger Bands feature.
Bollinger Bands Strategy: Bollinger Bands help you visualize price volatility. Look for potential reversal points when the price touches or crosses the upper or lower bands.
Use the "Fiboborsa+Bist" indicator to enhance your trading strategies and make informed decisions in the dynamic world of financial markets.
Additional Information:
Bollinger Bands: Bollinger Bands are a technical analysis tool used to monitor price volatility and determine overbought or oversold conditions. This indicator consists of three components:
Middle Moving Average (SMA): Typically, a 20-day SMA is used.
Upper Band: Calculated by adding two times the standard deviation to the SMA.
Lower Band: Calculated by subtracting two times the standard deviation from the SMA.
As the price moves between these two bands, it becomes possible to identify potential buying or selling points by comparing its height or low with these bands.
Ichimoku Cloud: The Ichimoku Cloud is a comprehensive indicator used for trend identification, defining support and resistance levels, and measuring trend strength. The Ichimoku Cloud comprises five key components:
Tenkan Sen (Conversion Line): Used to identify short-term trends.
Kijun Sen (Base Line): Used to identify medium-term trends.
Senkou Span A (Leading Span A): Calculated as (Tenkan Sen + Kijun Sen) / 2 and shows future support and resistance levels.
Senkou Span B (Leading Span B): Calculated as (highest high + lowest low) / 2 and indicates future support and resistance levels.
Chikou Span (Lagging Line): Enables tracking the price backward.
The Ichimoku Cloud interprets a price above the cloud as an uptrend and below the cloud as a downtrend. The Chikou Span assists in verifying the current trend.
ADDITIONAL STRATEGY WITH RSI AND MACD INDICATORS
**Strategy: Two-Stage Trading Strategy Using RSI, MACD, and Fiboborsa+Bist Indicators**
**Stage 1: Determining the Trend and Selecting the Trading Direction**
1. **Trend Identification with Fiboborsa+Bist Indicator:**
- Analyze the simple moving averages (SMA), exponential moving averages (EMA), and weighted moving averages (WMA) used with the Fiboborsa+Bist indicator. These indicators will provide information about the direction of the market trend.
2. **Identifying Overbought and Oversold Conditions with RSI:**
- Use the RSI indicator to identify overbought (70 and above) and oversold (30 and below) conditions. This helps in measuring the strength of the trend. If RSI enters the overbought zone, a downward correction is likely. If RSI enters the oversold zone, an upward correction is probable.
3. **Evaluating Momentum with MACD:**
- Examine price momentum using the MACD indicator. When the MACD line crosses above the signal line, it may indicate an increasing upward momentum. Conversely, a downward cross can suggest an increasing downward momentum.
**Stage 2: Generating Buy and Sell Signals**
4. **Combining RSI, MACD, and Fiboborsa+Bist Indicators:**
- To generate a buy signal, wait for RSI to move out of the oversold region into an uptrend and for the MACD line to cross above the signal line.
- To generate a sell signal, wait for RSI to move out of the overbought region into a downtrend and for the MACD line to cross below the signal line.
5. **Confirmation with Fiboborsa+Bist Indicator:**
- When you receive a buy or sell signal, use the Fiboborsa+Bist indicator to confirm the market trend. Confirming the trend can strengthen your trade signals.
6. **Setting Stop-Loss and Take-Profit Levels:**
- Remember to manage risk when opening buy or sell positions. Set stop-loss and take-profit levels to limit your risk.
7. **Monitor and Adjust Your Trades:**
- Continuously monitor your trade positions and adjust your strategy as per market conditions.
This two-stage trading strategy offers the ability to determine trends and generate trade signals using different indicators. However, every trading strategy involves risks, so risk management and practical application are essential. Also, it's recommended to test this strategy in a demo account before using it in a real trading account.

Multi-Timeframe Bias Dashboard + VolatilityWhat it is: A corner table (overlay) that gives a quick higher-timeframe read for Daily / 4H / 1H using EMA alignment, MACD, RSI, plus a volatility gauge.
How it works (per timeframe):
EMA block (50/100/200): “Above/Below/Mixed” based on price vs all three EMAs.
MACD: “Bullish/Bearish/Neutral” from MACD line vs Signal and histogram sign.
RSI: Prints the value and an ↑/↓ based on 50 line.
Volatility: Compares ATR(14) to its SMA over 20 bars → High (>*1.2), Normal, Low (<*0.8).
Bias: Combines three votes (EMA, MACD, RSI):
Bullish if ≥2 bullish, Bearish if ≥2 bearish, else Mixed.
Display:
Rows: D / 4H / 1H.
Columns: Bias, EMA(50/100/200), RSI, MACD, Volatility.
Bias cell is color-coded (green/red/gray).
Position setting lets you park the table in Top Right / Bottom Right / Bottom Left (works on mobile too).
Use it for:
Quickly aligning intraday setups with higher-TF direction.
Skipping low-volatility periods.
Confirming momentum (MACD/RSI) when price returns to your OB/FVG zones.

Gold Killzone Bias Suite🟡 Gold Killzone Bias Suite
The Gold Killzone Bias Suite is an advanced institutional-grade tool designed to generate high-confidence directional bias for XAU/USD (Gold) during the London and New York killzones.
Built for traders using a structured, confluence-driven approach, this tool blends price action, smart money principles, momentum, and volume into a real-time bias engine with a clean, easy-to-read dashboard.
🔧 Key Features
🕰️ Session-Based Bias (London / New York)
Independent bias calculation per session
Killzone times customizable with timezone support
Background highlighting (blue/red) for each session
📊 VWAP Engine
Reclaim & rejection detection
VWAP deviation alerts
Daily HTF VWAP integration
Score impact based on VWAP behaviour
📉 Market Structure (CHoCH / BOS)
Detects swing highs/lows
Labels bullish/bearish CHoCHs
Structure score contributes to session bias
💧 Liquidity Grabs
Detects stop hunts above highs / below lows
Confirms with candle rejection (body % filter)
Plots labels and adds to bias scoring
⚡ Momentum Filters
RSI: Bullish >55, Bearish <45
MACD: Histogram + Signal Line crossovers
Combined momentum score used in bias
🧠 Smart Money Proximity
Optional FVG/OB score toggle (placeholder for custom logic)
Adds static confluence for proximity-based setups
⏫ Higher Time Frame Context
Daily VWAP comparison
4H high/low structure breaks
Adds trend score to current session bias
🧠 How Bias Works
The suite uses a scoring model. Each confluence adds or subtracts points:
VWAP reclaim/reject: ±30
CHoCH/BOS: ±30
Liquidity grab: ±20
RSI/MACD: ±10
FVG/OB Proximity: +10
Daily VWAP trend: ±10
H4 Trend Break: ±10
Final Bias:
Bullish if score ≥ +20
Bearish if score ≤ -20
Neutral if between -19 and +19
A confidence % (capped at 100) is also shown, along with the contributing confluences (VWAP, Structure, Liquidity, etc.).
📋 Dashboard
A real-time dashboard shows for each session:
Session name and time
Bias (Bullish / Bearish / Neutral)
Confidence (%)
Confluences used
Position can be moved (Top Left, Top Right, etc.). Designed to be unobtrusive yet informative.
🧪 Best Practices
Use on 15m / 5m charts for intraday setups
Confirm with D1 or H4 structure for directional context
Combine with OB/FVG zones or SMT for entries
Use Trading View alerts for bias flips or liquidity grabs (custom logic can be added)
Bar Replay compatible for back testing and journaling bias shifts
🔐 Notes
Does not generate trade signals or alerts by default
Focused on bias generation and confluence stacking
Compatible with funded account trading models
📈 Built for traders who want a systematic, score-based approach to identifying directional edge in high-volume gold sessions.

Momentum Composite Indicator@CRYPTOSLIFE
This script creates a Momentum Composite Indicator (MCI) that combines four different momentum indicators: RSI, MACD, Stochastic Oscillator, and Rate of Change (ROC). Each of these indicators is calculated, normalized, and then combined with equal weights (25% each) to create the composite indicator. The script also includes a color change based on the change in the composite indicator's value.
Here's a brief explanation of the indicator:
Parameters: The script takes one input parameter, 'length,' which is used as the length for RSI, Stochastic Oscillator, and ROC calculations.
RSI: The Relative Strength Index (RSI) is calculated using the 'length' input parameter. The RSI is then normalized to range between 0 and 1.
MACD: The Moving Average Convergence Divergence (MACD) is calculated using the default lengths of 12, 26, and 9. The histogram is then computed as the difference between the MACD line and the signal line. The MACD histogram is normalized to range between 0 and 1.
Stochastic Oscillator: The Stochastic Oscillator is calculated using the 'length' input parameter, taking the lowest low and highest high over the specified period. The oscillator is then normalized to range between 0 and 1.
Rate of Change (ROC): The Rate of Change (ROC) is calculated using the 'length' input parameter. The ROC is then normalized to range between 0 and 1.
Composite Indicator: The normalized values of RSI, MACD, Stochastic Oscillator, and ROC are combined with equal weights to create the composite indicator.
Color Change: The line color changes based on the change in the composite indicator's value. If the value increases, the line color is green; if it decreases, the line color is red.
Plotting: The composite indicator is plotted on the chart with a linewidth of 5.
This Momentum Composite Indicator can help traders assess the overall momentum in the price movement of a financial instrument by combining the information from four popular momentum indicators.

DILM TRADING - Market Sentiment and FibonacciDILM TRADING - Market Sentiment and Fibonacci
Overview
The DILM TRADING - Market Sentiment and Fibonacci indicator is designed to provide traders with a comprehensive view of market trends and potential trading opportunities. By combining several popular technical indicators such as the SuperTrend, Fibonacci levels, and multiple sentiment indicators, this tool offers a deep analysis of market dynamics. Each component has been carefully selected to work in harmony, providing users with reliable entry and exit signals and helping them navigate volatile markets.
Why This Combination?
This indicator brings together different elements with specific purposes:
SuperTrend: A trend-following indicator that helps identify the market's current direction and acts as a dynamic stop-loss tool.
Fibonacci Levels: Known for pinpointing potential market reversal points, these levels provide crucial support and resistance areas for traders to set stop-losses and take-profits.
Sentiment Indicators: Tools like RSI, MACD, and Ichimoku are combined to gauge market momentum, allowing traders to assess whether a market is overbought or oversold, and whether the current trend is strong enough to continue or reverse.
The combination of these indicators gives traders a complete framework for analyzing the market: trend direction, market sentiment, and key price levels. Each of these elements works in tandem to provide signals that are both timely and accurate.
Key Features
SuperTrend
Based on the Average True Range (ATR), the SuperTrend indicator is an excellent way to determine the current trend. If the price is above the SuperTrend line, it suggests an uptrend, whereas if the price is below it, a downtrend is indicated. It is also a highly effective tool for setting trailing stop-losses, thereby improving risk management.
Fibonacci Levels
The script automatically calculates Fibonacci retracement levels based on the highest and lowest points within a specific timeframe. These levels are essential for identifying potential reversal zones, key areas for stop-losses, and take-profit levels. The levels adjust according to the prevailing trend, making them a dynamic and responsive tool for any market condition.
Sentiment Indicators
This section integrates multiple sentiment indicators to give a holistic view of market direction:
Ichimoku Cloud: Measures the strength of trends and identifies potential reversal zones using clouds (Kumo).
OBV (On-Balance Volume): Tracks volume changes to confirm the direction of price movements.
CMF (Chaikin Money Flow): Monitors the money flow to identify buying or selling pressure.
RSI (Relative Strength Index): Highlights overbought or oversold conditions, signaling potential trend reversals.
MACD: A reliable tool for identifying bullish and bearish crossovers.
ADX (Average Directional Index): Determines the strength of the prevailing trend, helping to confirm whether it's likely to continue or weaken.
Volatility Filter
The ATR (Average True Range) acts as a filter to identify periods of high or low volatility, helping traders to adapt their strategies to the current market environment. High volatility suggests larger price swings, potentially offering better trading opportunities, while low volatility indicates consolidation or range-bound conditions.
Order Blocks
The script visually identifies bullish and bearish order blocks on the chart. These zones represent areas where significant buying or selling occurred, making them crucial for spotting potential breakout or reversal points.
How to Use
Entry/Exit: Fibonacci levels (50% or 61.8%) serve as potential entry points, while the 0% and 100% levels can be used to set take-profit and stop-loss levels.
Sentiment Analysis: The overall market sentiment is derived from the combination of Ichimoku, OBV, CMF, RSI, ADX, and other tools, helping traders make informed decisions on whether to buy or sell.
Risk Management: Use SuperTrend and Fibonacci levels to set precise stop-loss points and improve risk management.
New Feature: Moving Average and RSI Confirmation
A recent addition allows users to calculate two moving averages (short and long) and the RSI on a timeframe of their choice. An entry signal is generated when the short moving average crosses above the long, and the RSI is below a specific threshold. Conversely, a sell signal is displayed when the short moving average crosses below the long, and the RSI is above a defined level.
Limitations
This indicator may be less effective during periods of low volatility or range-bound markets. It's important to use this tool in conjunction with other analysis techniques, as relying on a single indicator could lead to false signals.
DILM TRADING - Sentiment de marché et Fibonacci
Vue d'ensemble
L'indicateur DILM TRADING - Sentiment de marché et Fibonacci a été conçu pour offrir une vue d'ensemble des tendances du marché et des opportunités de trading potentielles. En combinant plusieurs indicateurs techniques populaires, tels que le SuperTrend, les niveaux de Fibonacci, et divers indicateurs de sentiment, cet outil fournit une analyse complète des dynamiques du marché. Chaque composant a été soigneusement sélectionné pour fonctionner ensemble, offrant des signaux d'entrée et de sortie fiables.
Pourquoi cette combinaison ?
Cette combinaison d'indicateurs permet de fournir un cadre complet pour analyser le marché. Le SuperTrend permet d'identifier la tendance, tandis que les niveaux de Fibonacci aident à déterminer les zones de retournement clés. Les indicateurs de sentiment, comme le RSI et le MACD, ajoutent une dimension supplémentaire en mesurant la force et la direction du marché.
Caractéristiques clés et Utilisation
SuperTrend : Indique la tendance actuelle et propose des niveaux de stop-loss dynamiques.
Niveaux de Fibonacci : Utilisés pour repérer des points de retournement potentiels et définir des niveaux de stop-loss et de take-profit.
Indicateurs de Sentiment : Outils comme l'Ichimoku, le RSI, et l'ADX fournissent une analyse globale du marché, permettant de prendre des décisions éclairées.
Nouvelle fonctionnalité : Confirmation des Moyennes Mobiles et RSI
Cette fonctionnalité permet d'utiliser deux moyennes mobiles et le RSI pour générer des signaux d'achat et de vente basés sur les croisements et les niveaux de surachat/survente du RSI.
Conclusion
Le DILM TRADING - Sentiment de marché et Fibonacci est un outil puissant et polyvalent, conçu pour les traders cherchant à affiner leurs stratégies grâce à une analyse complète des tendances et du sentiment du marché.

[CryptoWho] Multi DivergencesThis script looks for divergences on up to six indicators, sums them up and draw a histogram below the chart.
You have several options to customize the output:
1. indicators: RSI, Stoch RSI, MACD, CCI, OBV, WaveTrend (LazyBear)
2. Divergences: Regular, hidden, both
3. Lookback period for divergences
BITSTAMP:BTCUSD

StochRSI + RSI + MACDStochasticRSI, RSI, and a MACD all in one.
StochRSI with an RSI overlay. Relatively, the Overbought and Oversold lines are set at 30.9 and 69.1, respectively
Down below, a Normalized MACD.
The MACD, in the settings, can be adjusted between Exponential(closest to normal MACD) or Smoothed (Less Noise).
Normalization can be adjusted as well.
Optionally, you can change the background color of the MACD area based on the direction the MACD line is heading.

Custom Strategy Builder Raad V1This indicator is an advanced trading strategy builder that combines multiple technical indicators and analysis tools into a single script. Below is a simplified breakdown of its key components and functionalities.
Key Features & Components
1. Core Indicators
Moving Averages (EMA, SMA, WMA, HMA, VWMA) – Multiple types with customizable lengths.
Range Filter – A volatility-based trend filter.
SuperTrend – A trend-following indicator using ATR.
Half Trend – Another trend-following indicator.
Ichimoku Cloud – A comprehensive trend and support/resistance system.
2. Trend Indicators
Bollinger Bands – Volatility-based price channels.
MACD – Moving Average Convergence Divergence for momentum.
Parabolic SAR – A trailing stop indicator for trend direction.
Donchian Channel – Identifies breakout levels based on recent highs/lows.
3. Momentum Indicators
RSI (Relative Strength Index) – Measures overbought/oversold conditions.
Stochastic Oscillator – Another momentum indicator for reversals.
CCI (Commodity Channel Index) – Detects cyclical trends.
Awesome Oscillator (AO) – A histogram-based momentum tool.
4. Additional Analysis Tools
Fibonacci Retracement – Key support/resistance levels based on Fibonacci ratios.
Pivot Points – Calculates intraday support/resistance levels.
Supply/Demand Zones – Highlights key accumulation/distribution areas.
Volume Analysis – Includes VWAP and volume-based signals.
5. Dashboard & Customization
Switch Board – Enables/disables indicators on the chart.
Signal Filters – Adjusts confirmation rules for entries/exits.
Visual Customization – Change colors, line styles, and sizes.
How It Works
Leading Indicator – The primary signal generator (e.g., Range Filter, RSI, MACD).
Confirmation Indicators – Additional filters to validate signals (e.g., EMA cross, volume, trend strength).
Signal Expiry – Defines how long a signal remains valid before resetting.
Dashboard Display – Shows active signals and market conditions.
Best Use Cases
✅ Multi-Indicator Strategies – Combines multiple signals into one system.
✅ Trend & Momentum Trading – Works well for swing and intraday trading.
✅ Customizable Alerts – Can trigger buy/sell signals based on user-defined rules.
This indicator is ideal for traders who want a fully customizable and multi-strategy approach without manually overlaying multiple indicators.
هذا المؤشر هو أداة متقدمة لبناء استراتيجيات التداول تحتوي على مجموعة كبيرة من المؤشرات الفنية وأدوات التحليل. إليك شرح مبسط لمكوناته الرئيسية:
المكونات الرئيسية:
1. المؤشرات الأساسية:
المتوسطات المتحركة (EMA, SMA, WMA, HMA, VWMA): تسمح باختيار أنواع مختلفة من المتوسطات المتحركة بأطوال مختلفة.
Range Filter: مرشح يعتمد على مدى السعر لتحديد الاتجاه.
SuperTrend: مؤشر اتجاهي يعتمد على ATR.
Half Trend: مؤشر اتجاهي آخر.
Ichimoku Cloud: نظام إيشيموكو الكلاسيكي.
2. مؤشرات الاتجاه:
Bollinger Bands: نطاقات بولينجر.
MACD: مؤشر تقارب وتباعد المتوسطات المتحركة.
Parabolic SAR: مؤشر SAR القطعي المكافئ.
Donchian Channel: قناة دونشيان لتحديد القمم والقيعان.
3. مؤشرات الزخم:
RSI: مؤشر القوة النسبية.
Stochastic: مؤشر ستوكاستيك.
CCI: مؤشر قناة السلع.
Awesome Oscillator: مؤشر الزخم.
4. أدوات التحليل الأخرى:
Fibonacci Retracement: مستويات فيبوناتشي للتصحيح.
Pivot Points: نقاط محورية.
Supply/Demand Zones: مناطق العرض والطلب.
Volume Analysis: تحليل الحجم.
5. لوحة التحكم:
تسمح بتفعيل/تعطيل المؤشرات المختلفة.
تخصيص ألوان وعرض الخطوط.
ضبط معايير الإشارات.
طريقة العمل:
يحدد المؤشر إشارات شراء/بيع بناءً على تقاطعات المؤشرات المختلفة.
يمكن استخدام مؤشر رئيسي (Leading Indicator) مع مؤشرات تأكيد (Confirmation Indicators).
يوفر خيارات لتخصيص فترة انتهاء صلاحية الإشارة وطريقة العرض.
الاستخدام:
للمتداولين المتقدمين الذين يرغبون في بناء استراتيجيات معقدة.
يمكن استخدامه للتحليل الفني متعدد الأطر الزمنية.
يوفر مرونة كبيرة في تخصيص المؤشرات حسب احتياجات المستخدم.
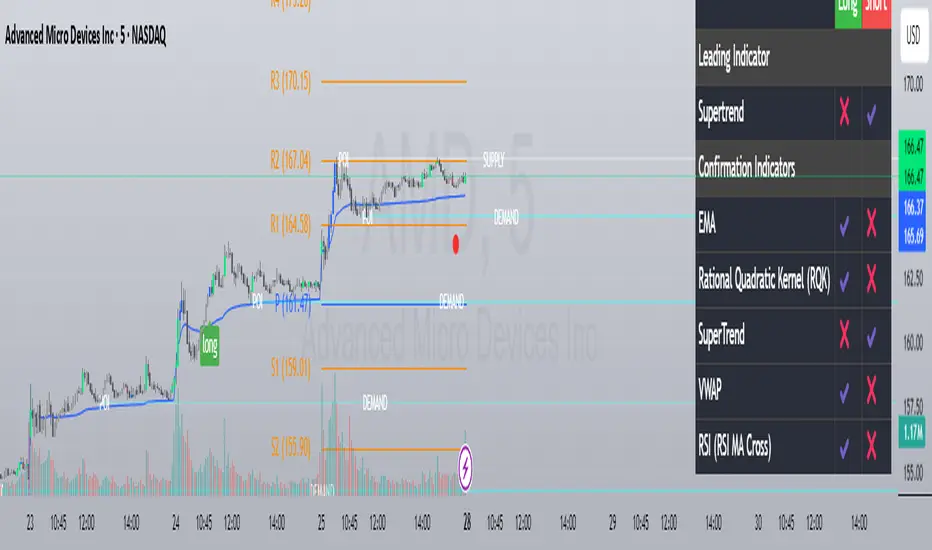
Indicators all in oneHello Everyone . Sometimes we need some indicators and each one needs seperated window. with this tool we can see indicators by choosing it from pull down menu, in the same window.
Currently you can choose RSI, MACD, Commodity Channel Index (CCI), Momentum, Stochastic, Stochastic RSI, Directional Movement Index (DMI), Chaikin Money Flow (CMF), On-Balance Volume (OBV), Average True Range (ATR), Volume Weigthed MACD (VWMACD).
some screen shots:
DMI:
MACD:
Stochastic RSI
Let me know if you need any other indicator in this tool.
Enjoy!
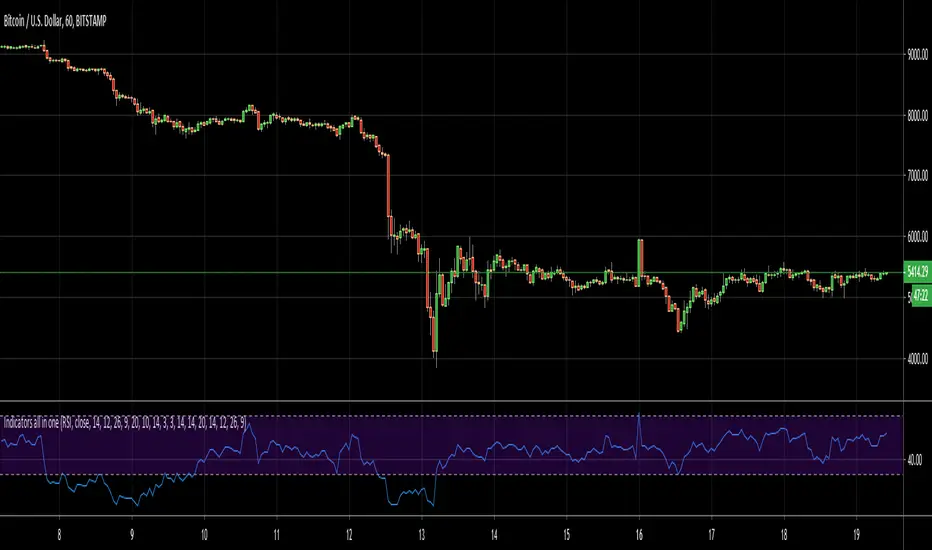
Dskyz (DAFE) AI Adaptive Regime - Beginners VersionDskyz (DAFE) AI Adaptive Regime - Pro: Revolutionizing Trading for All
Introduction
In the fast-paced world of financial markets, traders need tools that can keep up with ever-changing conditions while remaining accessible. The Dskyz (DAFE) AI Adaptive Regime - Pro is a groundbreaking TradingView strategy that delivers advanced, AI-driven trading capabilities to everyday traders. Available on TradingView (TradingView Scripts), this Pine Script strategy combines sophisticated market analysis with user-friendly features, making it a standout choice for both novice and experienced traders.
Core Functionality
The strategy is built to adapt to different market regimes—trending, ranging, volatile, or quiet—using a robust set of technical indicators, including:
Moving Averages (MA): Fast and slow EMAs to detect trend direction.
Average True Range (ATR): For dynamic stop-loss and volatility assessment.
Relative Strength Index (RSI) and MACD: Multi-timeframe confirmation of momentum and trend.
Average Directional Index (ADX): To identify trending markets.
Bollinger Bands: For assessing volatility and range conditions.
Candlestick Patterns: Recognizes patterns like bullish engulfing, hammer, and double bottoms, confirmed by volume spikes.
It generates buy and sell signals based on a scoring system that weighs these indicators, ensuring trades align with the current market environment. The strategy also includes dynamic risk management with ATR-based stops and trailing stops, as well as performance tracking to optimize future trades.
What Sets It Apart
The Dskyz (DAFE) AI Adaptive Regime - Pro distinguishes itself from other TradingView strategies through several unique features, which we compare to common alternatives below:
| Feature | Dskyz (DAFE) | Typical TradingView Strategies|
|---------|-------------|------------------------------------------------------------|
| Regime Detection | Automatically identifies and adapts to **four** market regimes | Often static or limited to trend/range detection |
| Multi‑Timeframe Analysis | Uses higher‑timeframe RSI/MACD for confirmation | Rarely incorporates multi‑timeframe data |
| Pattern Recognition | Detects candlestick patterns **with volume confirmation** | Limited or no pattern recognition |
| Dynamic Risk Management | ATR‑based stops and trailing stops | Often uses fixed stops or basic risk rules |
| Performance Tracking | Adjusts thresholds based on past performance | Typically static parameters |
| Beginner‑Friendly Presets | Aggressive, Conservative, Optimized profiles | Requires manual parameter tuning |
| Visual Cues | Color‑coded backgrounds for regimes | Basic or no visual aids |
The Dskyz strategy’s ability to integrate regime detection, multi-timeframe analysis, and user-friendly presets makes it uniquely versatile and accessible, addressing the needs of everyday traders who want professional-grade tools without the complexity.
-Key Features and Benefits
[Why It’s Ideal for Everyday Traders
⚡The Dskyz (DAFE) AI Adaptive Regime - Pro democratizes advanced trading by offering professional-grade tools in an accessible package. Unlike many TradingView strategies that require deep technical knowledge or fail in changing market conditions, this strategy simplifies complex analysis while maintaining robustness. Its presets and visual aids make it easy for beginners to start, while its adaptive features and performance tracking appeal to advanced traders seeking an edge.
🔄Limitations and Considerations
Market Dependency: Performance varies by market and timeframe. Backtesting is essential to ensure compatibility with your trading style.
Learning Curve: While presets simplify use, understanding regimes and indicators enhances effectiveness.
No Guaranteed Profits: Like all strategies, success depends on market conditions and proper execution. The Reddit discussion highlights skepticism about TradingView strategies’ universal success (Reddit Discussion).
Instrument Specificity: Optimized for futures (e.g., ES, NQ) due to fixed tick values. Test on other instruments like stocks or forex to verify compatibility.
📌Conclusion
The Dskyz (DAFE) AI Adaptive Regime - Pro is a revolutionary TradingView strategy that empowers everyday traders with advanced, AI-driven tools. Its ability to adapt to market regimes, confirm signals across timeframes, and manage risk dynamically. sets it apart from typical strategies. By offering beginner-friendly presets and visual cues, it makes sophisticated trading accessible without sacrificing power. Whether you’re a novice looking to trade smarter or a pro seeking a competitive edge, this strategy is your ticket to mastering the markets. Add it to your chart, backtest it, and join the elite traders leveraging AI to dominate. Trade like a boss today! 🚀
Use it with discipline. Use it with clarity. Trade smarter.
**I will continue to release incredible strategies and indicators until I turn this into a brand or until someone offers me a contract.
-Dskyz

Multi Oscillator Divergence IndicatorTradingview Built-in Divergence Indicator with RSI is extended for Price Divergence with
- RSI
- MACD
- Sochastic
- Money Flow
- Demand Index
- Chaikin Money Flow
Thanks to tradingview for providing this unique indicator.

[CryptoWho] Master Divergences (6 indicators)Extensive divergence spotting script, including 6 different indicators.
You can choose between RSI, Stoch RSI, MACD, CCI, OBV and WaveTrend (LazyBear) and define your look back period as well as the candle source the indicator should work on.
BITSTAMP:BTCUSD
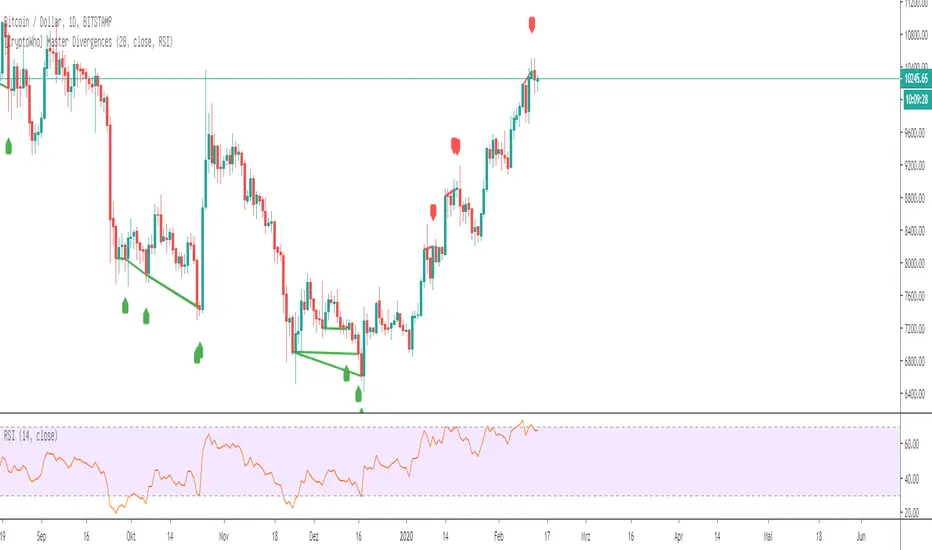
Dual Keltner ChannelsDual Keltner Channels (DKC) Indicator 📊
🔹 About This Indicator
This indicator is an enhanced version of the original Keltner Channel available in TradingView. The Keltner Channel was initially designed as a volatility-based envelope around a moving average, helping traders identify trends, breakouts, and potential reversal zones.
💡 Original Creator: The Keltner Channel concept is based on the work of Chester W. Keltner and was later implemented in various trading platforms, including TradingView’s built-in Keltner Channel indicator.
This script builds upon the TradingView version of the Keltner Channel, adding:
✅ Dual Keltner Bands (Inner & Outer) for better trend and volatility analysis.
✅ Customizable Moving Averages (EMA/SMA) for flexibility.
✅ Multiple Band Calculation Methods (ATR, True Range, Range) for improved accuracy.
✅ Shaded Zones Between the Bands for enhanced visual clarity.
⚡ Credit: This indicator is an enhancement of the original Keltner Channel Indicator in TradingView. All improvements and modifications are made to provide deeper market insights while maintaining the core principles of the original Keltner concept.
🔹 Overview
The Dual Keltner Channels (DKC) indicator overlays two Keltner Channels on the price chart, helping traders spot trends, breakouts, and reversals with greater precision.
Inner Keltner Band (Multiplier 1): Captures normal price movements.
Outer Keltner Band (Multiplier 2): Highlights extreme price movements and potential breakouts.
🔹 Features & Inputs
📌 Main Inputs:
Keltner Channel Length: Defines the lookback period for the moving average calculation.
Source Price: Selects the price type (close, open, high, low) to calculate the bands.
Exponential Moving Average (EMA) Option: Choose between Exponential (EMA) or Simple (SMA) as the basis for calculations.
Bands Style: Selects how the volatility is measured:
Average True Range (ATR) (default)
True Range (TR)
Range (High - Low)
ATR Length: Determines the length of ATR calculations.
Enable Multiplier 1 & 2: Toggle to display/hide inner (multiplier 1) and outer (multiplier 2) bands.
📌 Keltner Channels Calculation:
Moving Average (MA): Uses either EMA or SMA for the midline.
Volatility Band Calculation:
Upper Band 1 (Inner Band): MA + (Multiplier 1 × Volatility Measure)
Lower Band 1 (Inner Band): MA - (Multiplier 1 × Volatility Measure)
Upper Band 2 (Outer Band): MA + (Multiplier 2 × Volatility Measure)
Lower Band 2 (Outer Band): MA - (Multiplier 2 × Volatility Measure)
📌 Visuals & Plotting:
Inner Bands (Multiplier 1): Blue upper & lower lines.
Outer Bands (Multiplier 2): Darker blue upper & lower lines.
Basis Line: White moving average.
Shaded Areas:
Between Upper 1 & Upper 2 (Light Brown Area): Identifies the upper Keltner region.
Between Lower 1 & Lower 2 (Light Brown Area): Identifies the lower Keltner region.
🔹 How to Use the Dual Keltner Channels Indicator
✅ 1. Trend Identification
Price above the upper outer band (Multiplier 2): Strong uptrend – potential continuation.
Price below the lower outer band (Multiplier 2): Strong downtrend – potential continuation.
Price within the inner bands (Multiplier 1): Sideways market – possible consolidation.
✅ 2. Breakout Trading
Break above outer upper band: Indicates a bullish breakout – consider long trades.
Break below outer lower band: Indicates a bearish breakdown – consider short trades.
✅ 3. Overbought & Oversold Conditions
Price touching/exceeding outer bands (Multiplier 2): Potential reversal zones.
Reversal confirmation: Look for candlestick patterns (e.g., Doji, Engulfing) or divergence signals.
✅ 4. Pullback & Entry Zones
Price bouncing from inner bands (Multiplier 1): Good re-entry point in trend direction.
Inner band as support/resistance: Helps in setting stop-loss and profit targets.
🔹 Effective Trading Strategies Using DKC
📌 1. Trend Following Strategy (Using Moving Average & Bands)
✅ Look for price staying above/below the basis line (MA) within the outer bands.
✅ Use pullbacks to the inner bands as re-entry points for trend continuation.
✅ Confirm trend strength with momentum indicators like RSI, MACD.
📌 2. Breakout Trading Strategy
✅ Identify a tight consolidation phase within the inner Keltner bands.
✅ Wait for a strong breakout beyond the outer bands.
✅ Enter long/short trades based on breakout direction.
✅ Place stop-loss at the previous inner band to manage risk.
📌 3. Reversal Strategy (Mean Reversion)
✅ When price extends beyond the outer band (Multiplier 2), look for reversal signals (candlestick patterns, RSI divergence).
✅ Enter counter-trend trades with tight stop-loss beyond the band.
✅ Target the moving average (basis line) as take-profit.
🔹 Final Thoughts 💡
The Dual Keltner Channels (DKC) is a powerful upgrade to the standard Keltner Channel, providing:
✅ Greater clarity on trend strength
✅ More precise breakout & reversal signals
✅ Better visual insights for dynamic market conditions
📌 Best Used With: RSI, MACD, Volume Profile, Price Action Signals.
📌 Works on: Stocks, Forex, Crypto, Commodities, Indices.

SMI Ergodic Indicator + OscillatorThis indicator is one that I came across a while ago. The main way this indicator works is a lot like the True Strength Index except it also adds a signal line. I like to think of it as a faster MACD that gives you a chance to lag a little less behind the MACD. This of course comes with the additional risk of fake-outs being prevalent. The signal line in the indicator allows you to use the EMA in the indicator itself and adds another indicator that it's either going to do a reversal or confirm trend.
In the indicator I created it has the Oversold and Overbought areas highlighted to show the oscillators function as kind of an RSI + MACD indicator. There is also added crossing alerts in the form of circles (or whatever you want to change it to) indicating a cross of the SMI line and the Signal EMA line. This is usually the point where you want to make an entrance or exit point. The Overbought and Oversold zones are adjustable to wherever you as a trader feel comfortable having them be.
I also combined bother the SMI and Signal line with the SMI Oscillator adding a histogram.

Money Machine God MAThis is intended for cryptocurrencies.
Top Down
BB, RSI, MACD
The dark green nand pink are bollinger bands. When the green line (RSI) crosses them becareful. When the green line crosses the red line then you have a buy signal. The white line is the MACD. A sell signal is when the green line is below the white line. You can use this for exploding coins at 1 and 3 minutes.
MA
These are moving averages, 7 21 77 and 231. When the green line is above the white, orange, and red then you have a buy signal. The green line is the most important. You can get a buy signal once green is above red for shorter plays.
Ichimoku
Cyan line above orange line also known as TK cross is a buy signal. Cloud breakout is when the price is above the cloud. The 20 60 120 30 allows for less false positives.
Ichimoku on steroids
Once the cyan line crosses the middle cyan line or the 0 value, then that is a buy signal.

Market Zone Analyzer[BullByte]Understanding the Market Zone Analyzer
---
1. Purpose of the Indicator
The Market Zone Analyzer is a Pine Script™ (version 6) indicator designed to streamline market analysis on TradingView. Rather than scanning multiple separate tools, it unifies four core dimensions—trend strength, momentum, price action, and market activity—into a single, consolidated view. By doing so, it helps traders:
• Save time by avoiding manual cross-referencing of disparate signals.
• Reduce decision-making errors that can arise from juggling multiple indicators.
• Gain a clear, reliable read on whether the market is in a bullish, bearish, or sideways phase, so they can more confidently decide to enter, exit, or hold a position.
---
2. Why a Trader Should Use It
• Unified View: Combines all essential market dimensions into one easy-to-read score and dashboard, eliminating the need to piece together signals manually.
• Adaptability: Automatically adjusts its internal weighting for trend, momentum, and price action based on current volatility. Whether markets are choppy or calm, the indicator remains relevant.
• Ease of Interpretation: Outputs a simple “BULLISH,” “BEARISH,” or “SIDEWAYS” label, supplemented by an intuitive on-chart dashboard and an oscillator plot that visually highlights market direction.
• Reliability Features: Built-in smoothing of the net score and hysteresis logic (requiring consecutive confirmations before flips) minimize false signals during noisy or range-bound phases.
---
3. Why These Specific Indicators?
This script relies on a curated set of well-established technical tools, each chosen for its particular strength in measuring one of the four core dimensions:
1. Trend Strength:
• ADX/DMI (Average Directional Index / Directional Movement Index): Measures how strong a trend is, and whether the +DI line is above the –DI line (bullish) or vice versa (bearish).
• Moving Average Slope (Fast MA vs. Slow MA): Compares a shorter-period SMA to a longer-period SMA; if the fast MA sits above the slow MA, it confirms an uptrend, and vice versa for a downtrend.
• Ichimoku Cloud Differential (Senkou A vs. Senkou B): Provides a forward-looking view of trend direction; Senkou A above Senkou B signals bullishness, and the opposite signals bearishness.
2. Momentum:
• Relative Strength Index (RSI): Identifies overbought (above its dynamically calculated upper bound) or oversold (below its lower bound) conditions; changes in RSI often precede price reversals.
• Stochastic %K: Highlights shifts in short-term momentum by comparing closing price to the recent high/low range; values above its upper band signal bullish momentum, below its lower band signal bearish momentum.
• MACD Histogram: Measures the difference between the MACD line and its signal line; a positive histogram indicates upward momentum, a negative histogram indicates downward momentum.
3. Price Action:
• Highest High / Lowest Low (HH/LL) Range: Over a defined lookback period, this captures breakout or breakdown levels. A closing price near the recent highs (with a positive MA slope) yields a bullish score, and near the lows (with a negative MA slope) yields a bearish score.
• Heikin-Ashi Doji Detection: Uses Heikin-Ashi candles to identify indecision or continuation patterns. A small Heikin-Ashi body (doji) relative to recent volatility is scored as neutral; a larger body in the direction of the MA slope is scored bullish or bearish.
• Candle Range Measurement: Compares each candle’s high-low range against its own dynamic band (average range ± standard deviation). Large candles aligning with the prevailing trend score bullish or bearish accordingly; unusually small candles can indicate exhaustion or consolidation.
4. Market Activity:
• Bollinger Bands Width (BBW): Measures the distance between BB upper and lower bands; wide bands indicate high volatility, narrow bands indicate low volatility.
• Average True Range (ATR): Quantifies average price movement (volatility). A sudden spike in ATR suggests a volatile environment, while a contraction suggests calm.
• Keltner Channels Width (KCW): Similar to BBW but uses ATR around an EMA. Provides a second layer of volatility context, confirming or contrasting BBW readings.
• Volume (with Moving Average): Compares current volume to its moving average ± standard deviation. High volume validates strong moves; low volume signals potential lack of conviction.
By combining these tools, the indicator captures trend direction, momentum strength, price-action nuances, and overall market energy, yielding a more balanced and comprehensive assessment than any single tool alone.
---
4. What Makes This Indicator Stand Out
• Multi-Dimensional Analysis: Rather than relying on a lone oscillator or moving average crossover, it simultaneously evaluates trend, momentum, price action, and activity.
• Dynamic Weighting: The relative importance of trend, momentum, and price action adjusts automatically based on real-time volatility (Market Activity State). For example, in highly volatile conditions, trend and momentum signals carry more weight; in calm markets, price action signals are prioritized.
• Stability Mechanisms:
• Smoothing: The net score is passed through a short moving average, filtering out noise, especially on lower timeframes.
• Hysteresis: Both Market Activity State and the final bullish/bearish/sideways zone require two consecutive confirmations before flipping, reducing whipsaw.
• Visual Interpretation: A fully customizable on-chart dashboard displays each sub-indicator’s value, regime, score, and comment, all color-coded. The oscillator plot changes color to reflect the current market zone (green for bullish, red for bearish, gray for sideways) and shows horizontal threshold lines at +2, 0, and –2.
---
5. Recommended Timeframes
• Short-Term (5 min, 15 min): Day traders and scalpers can benefit from rapid signals, but should enable smoothing (and possibly disable hysteresis) to reduce false whipsaws.
• Medium-Term (1 h, 4 h): Swing traders find a balance between responsiveness and reliability. Less smoothing is required here, and the default parameters (e.g., ADX length = 14, RSI length = 14) perform well.
• Long-Term (Daily, Weekly): Position traders tracking major trends can disable smoothing for immediate raw readings, since higher-timeframe noise is minimal. Adjust lookback lengths (e.g., increase adxLength, rsiLength) if desired for slower signals.
Tip: If you keep smoothing off, stick to timeframes of 1 h or higher to avoid excessive signal “chatter.”
---
6. How Scoring Works
A. Individual Indicator Scores
Each sub-indicator is assigned one of three discrete scores:
• +1 if it indicates a bullish condition (e.g., RSI above its dynamically calculated upper bound).
• 0 if it is neutral (e.g., RSI between upper and lower bounds).
• –1 if it indicates a bearish condition (e.g., RSI below its dynamically calculated lower bound).
Examples of individual score assignments:
• ADX/DMI:
• +1 if ADX ≥ adxThreshold and +DI > –DI (strong bullish trend)
• –1 if ADX ≥ adxThreshold and –DI > +DI (strong bearish trend)
• 0 if ADX < adxThreshold (trend strength below threshold)
• RSI:
• +1 if RSI > RSI_upperBound
• –1 if RSI < RSI_lowerBound
• 0 otherwise
• ATR (as part of Market Activity):
• +1 if ATR > (ATR_MA + stdev(ATR))
• –1 if ATR < (ATR_MA – stdev(ATR))
• 0 otherwise
Each of the four main categories shares this same +1/0/–1 logic across their sub-components.
B. Category Scores
Once each sub-indicator reports +1, 0, or –1, these are summed within their categories as follows:
• Trend Score = (ADX score) + (MA slope score) + (Ichimoku differential score)
• Momentum Score = (RSI score) + (Stochastic %K score) + (MACD histogram score)
• Price Action Score = (Highest-High/Lowest-Low score) + (Heikin-Ashi doji score) + (Candle range score)
• Market Activity Raw Score = (BBW score) + (ATR score) + (KC width score) + (Volume score)
Each category’s summed value can range between –3 and +3 (for Trend, Momentum, and Price Action), and between –4 and +4 for Market Activity raw.
C. Market Activity State and Dynamic Weight Adjustments
Rather than contributing directly to the netScore like the other three categories, Market Activity determines how much weight to assign to Trend, Momentum, and Price Action:
1. Compute Market Activity Raw Score by summing BBW, ATR, KCW, and Volume individual scores (each +1/0/–1).
2. Bucket into High, Medium, or Low Activity:
• High if raw Score ≥ 2 (volatile market).
• Low if raw Score ≤ –2 (calm market).
• Medium otherwise.
3. Apply Hysteresis (if enabled): The state only flips after two consecutive bars register the same high/low/medium label.
4. Set Category Weights:
• High Activity: Trend = 50 %, Momentum = 35 %, Price Action = 15 %.
• Low Activity: Trend = 25 %, Momentum = 20 %, Price Action = 55 %.
• Medium Activity: Use the trader’s base weight inputs (e.g., Trend = 40 %, Momentum = 30 %, Price Action = 30 % by default).
D. Calculating the Net Score
5. Normalize Base Weights (so that the sum of Trend + Momentum + Price Action always equals 100 %).
6. Determine Current Weights based on the Market Activity State (High/Medium/Low).
7. Compute Each Category’s Contribution: Multiply (categoryScore) × (currentWeight).
8. Sum Contributions to get the raw netScore (a floating-point value that can exceed ±3 when scores are strong).
9. Smooth the netScore over two bars (if smoothing is enabled) to reduce noise.
10. Apply Hysteresis to the Final Zone:
• If the smoothed netScore ≥ +2, the bar is classified as “Bullish.”
• If the smoothed netScore ≤ –2, the bar is classified as “Bearish.”
• Otherwise, it is “Sideways.”
• To prevent rapid flips, the script requires two consecutive bars in the new zone before officially changing the displayed zone (if hysteresis is on).
E. Thresholds for Zone Classification
• BULLISH: netScore ≥ +2
• BEARISH: netScore ≤ –2
• SIDEWAYS: –2 < netScore < +2
---
7. Role of Volatility (Market Activity State) in Scoring
Volatility acts as a dynamic switch that shifts which category carries the most influence:
1. High Activity (Volatile):
• Detected when at least two sub-scores out of BBW, ATR, KCW, and Volume equal +1.
• The script sets Trend weight = 50 % and Momentum weight = 35 %. Price Action weight is minimized at 15 %.
• Rationale: In volatile markets, strong trending moves and momentum surges dominate, so those signals are more reliable than nuanced candle patterns.
2. Low Activity (Calm):
• Detected when at least two sub-scores out of BBW, ATR, KCW, and Volume equal –1.
• The script sets Price Action weight = 55 %, Trend = 25 %, and Momentum = 20 %.
• Rationale: In quiet, sideways markets, subtle price-action signals (breakouts, doji patterns, small-range candles) are often the best early indicators of a new move.
3. Medium Activity (Balanced):
• Raw Score between –1 and +1 from the four volatility metrics.
• Uses whatever base weights the trader has specified (e.g., Trend = 40 %, Momentum = 30 %, Price Action = 30 %).
Because volatility can fluctuate rapidly, the script employs hysteresis on Market Activity State: a new High or Low state must occur on two consecutive bars before weights actually shift. This avoids constant back-and-forth weight changes and provides more stability.
---
8. Scoring Example (Hypothetical Scenario)
• Symbol: Bitcoin on a 1-hour chart.
• Market Activity: Raw volatility sub-scores show BBW (+1), ATR (+1), KCW (0), Volume (+1) → Total raw Score = +3 → High Activity.
• Weights Selected: Trend = 50 %, Momentum = 35 %, Price Action = 15 %.
• Trend Signals:
• ADX strong and +DI > –DI → +1
• Fast MA above Slow MA → +1
• Ichimoku Senkou A > Senkou B → +1
→ Trend Score = +3
• Momentum Signals:
• RSI above upper bound → +1
• MACD histogram positive → +1
• Stochastic %K within neutral zone → 0
→ Momentum Score = +2
• Price Action Signals:
• Highest High/Lowest Low check yields 0 (close not near extremes)
• Heikin-Ashi doji reading is neutral → 0
• Candle range slightly above upper bound but trend is strong, so → +1
→ Price Action Score = +1
• Compute Net Score (before smoothing):
• Trend contribution = 3 × 0.50 = 1.50
• Momentum contribution = 2 × 0.35 = 0.70
• Price Action contribution = 1 × 0.15 = 0.15
• Raw netScore = 1.50 + 0.70 + 0.15 = 2.35
• Since 2.35 ≥ +2 and hysteresis is met, the final zone is “Bullish.”
Although the netScore lands at 2.35 (Bullish), smoothing might bring it slightly below 2.00 on the first bar (e.g., 1.90), in which case the script would wait for a second consecutive reading above +2 before officially classifying the zone as Bullish (if hysteresis is enabled).
---
9. Correlation Between Categories
The four categories—Trend Strength, Momentum, Price Action, and Market Activity—often reinforce or offset one another. The script takes advantage of these natural correlations:
• Bullish Alignment: If ADX is strong and pointed upward, fast MA is above slow MA, and Ichimoku is positive, that usually coincides with RSI climbing above its upper bound and the MACD histogram turning positive. In such cases, both Trend and Momentum categories generate +1 or +2. Because the Market Activity State is likely High (given the accompanying volatility), Trend and Momentum weights are at their peak, so the netScore quickly crosses into Bullish territory.
• Sideways/Consolidation: During a low-volatility, sideways phase, ADX may fall below its threshold, MAs may flatten, and RSI might hover in the neutral band. However, subtle price-action signals (like a small breakout candle or a Heikin-Ashi candle with a slight bias) can still produce a +1 in the Price Action category. If Market Activity is Low, Price Action’s weight (55 %) can carry enough influence—even if Trend and Momentum are neutral—to push the netScore out of “Sideways” into a mild bullish or bearish bias.
• Opposing Signals: When Trend is bullish but Momentum turns negative (for example, price continues up but RSI rolls over), the two scores can partially cancel. Market Activity may remain Medium, in which case the netScore lingers near zero (Sideways). The trader can then wait for either a clearer momentum shift or a fresh price-action breakout before committing.
By dynamically recognizing these correlations and adjusting weights, the indicator ensures that:
• When Trend and Momentum align (and volatility supports it), the netScore leaps strongly into Bullish or Bearish.
• When Trend is neutral but Price Action shows an early move in a low-volatility environment, Price Action’s extra weight in the Low Activity State can still produce actionable signals.
---
10. Market Activity State & Its Role (Detailed)
The Market Activity State is not a direct category score—it is an overarching context setter for how heavily to trust Trend, Momentum, or Price Action. Here’s how it is derived and applied:
1. Calculate Four Volatility Sub-Scores:
• BBW: Compare the current band width to its own moving average ± standard deviation. If BBW > (BBW_MA + stdev), assign +1 (high volatility); if BBW < (BBW_MA × 0.5), assign –1 (low volatility); else 0.
• ATR: Compare ATR to its moving average ± standard deviation. A spike above the upper threshold is +1; a contraction below the lower threshold is –1; otherwise 0.
• KCW: Same logic as ATR but around the KCW mean.
• Volume: Compare current volume to its volume MA ± standard deviation. Above the upper threshold is +1; below the lower threshold is –1; else 0.
2. Sum Sub-Scores → Raw Market Activity Score: Range between –4 and +4.
3. Assign Market Activity State:
• High Activity: Raw Score ≥ +2 (at least two volatility metrics are strongly spiking).
• Low Activity: Raw Score ≤ –2 (at least two metrics signal unusually low volatility or thin volume).
• Medium Activity: Raw Score is between –1 and +1 inclusive.
4. Hysteresis for Stability:
• If hysteresis is enabled, a new state only takes hold after two consecutive bars confirm the same High, Medium, or Low label.
• This prevents the Market Activity State from bouncing around when volatility is on the fence.
5. Set Category Weights Based on Activity State:
• High Activity: Trend = 50 %, Momentum = 35 %, Price Action = 15 %.
• Low Activity: Trend = 25 %, Momentum = 20 %, Price Action = 55 %.
• Medium Activity: Use trader’s base weights (e.g., Trend = 40 %, Momentum = 30 %, Price Action = 30 %).
6. Impact on netScore: Because category scores (–3 to +3) multiply by these weights, High Activity amplifies the effect of strong Trend and Momentum scores; Low Activity amplifies the effect of Price Action.
7. Market Context Tooltip: The dashboard includes a tooltip summarizing the current state—e.g., “High activity, trend and momentum prioritized,” “Low activity, price action prioritized,” or “Balanced market, all categories considered.”
---
11. Category Weights: Base vs. Dynamic
Traders begin by specifying base weights for Trend Strength, Momentum, and Price Action that sum to 100 %. These apply only when volatility is in the Medium band. Once volatility shifts:
• High Volatility Overrides:
• Trend jumps from its base (e.g., 40 %) to 50 %.
• Momentum jumps from its base (e.g., 30 %) to 35 %.
• Price Action is reduced to 15 %.
Example: If base weights were Trend = 40 %, Momentum = 30 %, Price Action = 30 %, then in High Activity they become 50/35/15. A Trend score of +3 now contributes 3 × 0.50 = +1.50 to netScore; a Momentum +2 contributes 2 × 0.35 = +0.70. In total, Trend + Momentum can easily push netScore above the +2 threshold on its own.
• Low Volatility Overrides:
• Price Action leaps from its base (30 %) to 55 %.
• Trend falls to 25 %, Momentum falls to 20 %.
Why? When markets are quiet, subtle candle breakouts, doji patterns, and small-range expansions tend to foreshadow the next swing more effectively than raw trend readings. A Price Action score of +3 in this state contributes 3 × 0.55 = +1.65, which can carry the netScore toward +2—even if Trend and Momentum are neutral or only mildly positive.
Because these weight shifts happen only after two consecutive bars confirm a High or Low state (if hysteresis is on), the indicator avoids constantly flipping its emphasis during borderline volatility phases.
---
12. Dominant Category Explained
Within the dashboard, a label such as “Trend Dominant,” “Momentum Dominant,” or “Price Action Dominant” appears when one category’s absolute weighted contribution to netScore is the largest. Concretely:
• Compute each category’s weighted contribution = (raw category score) × (current weight).
• Compare the absolute values of those three contributions.
• The category with the highest absolute value is flagged as Dominant for that bar.
Why It Matters:
• Momentum Dominant: Indicates that the combined force of RSI, Stochastic, and MACD (after weighting) is pushing netScore farther than either Trend or Price Action. In practice, it means that short-term sentiment and speed of change are the primary drivers right now, so traders should watch for continued momentum signals before committing to a trade.
• Trend Dominant: Means ADX, MA slope, and Ichimoku (once weighted) outweigh the other categories. This suggests a strong directional move is in place; trend-following entries or confirming pullbacks are likely to succeed.
• Price Action Dominant: Occurs when breakout/breakdown patterns, Heikin-Ashi candle readings, and range expansions (after weighting) are the most influential. This often happens in calmer markets, where subtle shifts in candle structure can foreshadow bigger moves.
By explicitly calling out which category is carrying the most weight at any moment, the dashboard gives traders immediate insight into why the netScore is tilting toward bullish, bearish, or sideways.
---
13. Oscillator Plot: How to Read It
The “Net Score” oscillator sits below the dashboard and visually displays the smoothed netScore as a line graph. Key features:
1. Value Range: In normal conditions it oscillates roughly between –3 and +3, but extreme confluences can push it outside that range.
2. Horizontal Threshold Lines:
• +2 Line (Bullish threshold)
• 0 Line (Neutral midline)
• –2 Line (Bearish threshold)
3. Zone Coloring:
• Green Background (Bullish Zone): When netScore ≥ +2.
• Red Background (Bearish Zone): When netScore ≤ –2.
• Gray Background (Sideways Zone): When –2 < netScore < +2.
4. Dynamic Line Color:
• The plotted netScore line itself is colored green in a Bullish Zone, red in a Bearish Zone, or gray in a Sideways Zone, creating an immediate visual cue.
Interpretation Tips:
• Crossing Above +2: Signals a strong enough combined trend/momentum/price-action reading to classify as Bullish. Many traders wait for a clear crossing plus a confirmation candle before entering a long position.
• Crossing Below –2: Indicates a strong Bearish signal. Traders may consider short or exit strategies.
• Rising Slope, Even Below +2: If netScore climbs steadily from neutral toward +2, it demonstrates building bullish momentum.
• Divergence: If price makes a higher high but the oscillator fails to reach a new high, it can warn of weakening momentum and a potential reversal.
---
14. Comments and Their Necessity
Every sub-indicator (ADX, MA slope, Ichimoku, RSI, Stochastic, MACD, HH/LL, Heikin-Ashi, Candle Range, BBW, ATR, KCW, Volume) generates a short comment that appears in the detailed dashboard. Examples:
• “Strong bullish trend” or “Strong bearish trend” for ADX/DMI
• “Fast MA above slow MA” or “Fast MA below slow MA” for MA slope
• “RSI above dynamic threshold” or “RSI below dynamic threshold” for RSI
• “MACD histogram positive” or “MACD histogram negative” for MACD Hist
• “Price near highs” or “Price near lows” for HH/LL checks
• “Bullish Heikin Ashi” or “Bearish Heikin Ashi” for HA Doji scoring
• “Large range, trend confirmed” or “Small range, trend contradicted” for Candle Range
Additionally, the top-row comment for each category is:
• Trend: “Highly Bullish,” “Highly Bearish,” or “Neutral Trend.”
• Momentum: “Strong Momentum,” “Weak Momentum,” or “Neutral Momentum.”
• Price Action: “Bullish Action,” “Bearish Action,” or “Neutral Action.”
• Market Activity: “Volatile Market,” “Calm Market,” or “Stable Market.”
Reasons for These Comments:
• Transparency: Shows exactly how each sub-indicator contributed to its category score.
• Education: Helps traders learn why a category is labeled bullish, bearish, or neutral, building intuition over time.
• Customization: If, for example, the RSI comment says “RSI neutral” despite an impending trend shift, a trader might choose to adjust RSI length or thresholds.
In the detailed dashboard, hovering over each comment cell also reveals a tooltip with additional context (e.g., “Fast MA above slow MA” or “Senkou A above Senkou B”), helping traders understand the precise rule behind that +1, 0, or –1 assignment.
---
15. Real-Life Example (Consolidated)
• Instrument & Timeframe: Bitcoin (BTCUSD), 1-hour chart.
• Current Market Activity: BBW and ATR both spike (+1 each), KCW is moderately high (+1), but volume is only neutral (0) → Raw Market Activity Score = +2 → State = High Activity (after two bars, if hysteresis is on).
• Category Weights Applied: Trend = 50 %, Momentum = 35 %, Price Action = 15 %.
• Trend Sub-Scores:
1. ADX = 25 (above threshold 20) with +DI > –DI → +1.
2. Fast MA (20-period) sits above Slow MA (50-period) → +1.
3. Ichimoku: Senkou A > Senkou B → +1.
→ Trend Score = +3.
• Momentum Sub-Scores:
4. RSI = 75 (above its moving average +1 stdev) → +1.
5. MACD histogram = +0.15 → +1.
6. Stochastic %K = 50 (mid-range) → 0.
→ Momentum Score = +2.
• Price Action Sub-Scores:
7. Price is not within 1 % of the 20-period high/low and slope = positive → 0.
8. Heikin-Ashi body is slightly larger than stdev over last 5 bars with haClose > haOpen → +1.
9. Candle range is just above its dynamic upper bound but trend is already captured, so → +1.
→ Price Action Score = +2.
• Calculate netScore (before smoothing):
• Trend contribution = 3 × 0.50 = 1.50
• Momentum contribution = 2 × 0.35 = 0.70
• Price Action contribution = 2 × 0.15 = 0.30
• Raw netScore = 1.50 + 0.70 + 0.30 = 2.50 → Immediately classified as Bullish.
• Oscillator & Dashboard Output:
• The oscillator line crosses above +2 and turns green.
• Dashboard displays:
• Trend Regime “BULLISH,” Trend Score = 3, Comment = “Highly Bullish.”
• Momentum Regime “BULLISH,” Momentum Score = 2, Comment = “Strong Momentum.”
• Price Action Regime “BULLISH,” Price Action Score = 2, Comment = “Bullish Action.”
• Market Activity State “High,” Comment = “Volatile Market.”
• Weights: Trend 50 %, Momentum 35 %, Price Action 15 %.
• Dominant Category: Trend (because 1.50 > 0.70 > 0.30).
• Overall Score: 2.50, posCount = (three +1s in Trend) + (two +1s in Momentum) + (two +1s in Price Action) = 7 bullish signals, negCount = 0.
• Final Zone = “BULLISH.”
• The trader sees that both Trend and Momentum are reinforcing each other under high volatility. They might wait one more candle for confirmation but already have strong evidence to consider a long.
---
• .
---
Disclaimer
This indicator is strictly a technical analysis tool and does not constitute financial advice. All trading involves risk, including potential loss of capital. Past performance is not indicative of future results. Traders should:
• Always backtest the “Market Zone Analyzer ” on their chosen symbols and timeframes before committing real capital.
• Combine this tool with sound risk management, position sizing, and, if possible, fundamental analysis.
• Understand that no indicator is foolproof; always be prepared for unexpected market moves.
Goodluck
-BullByte!
---
